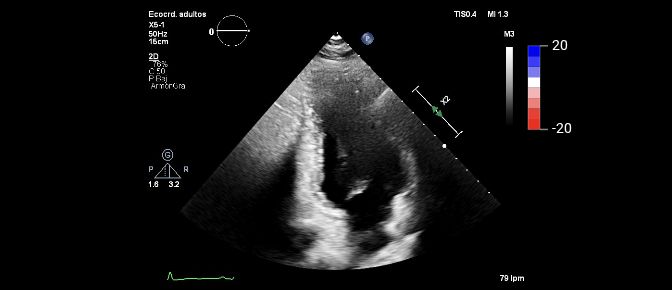
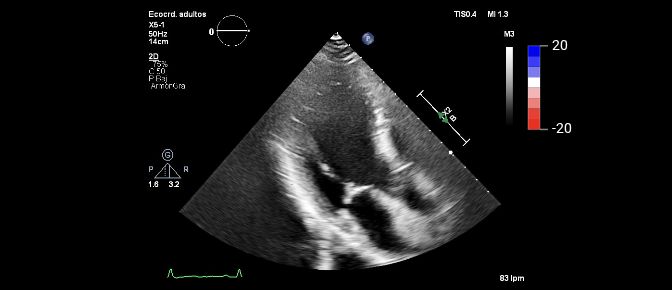
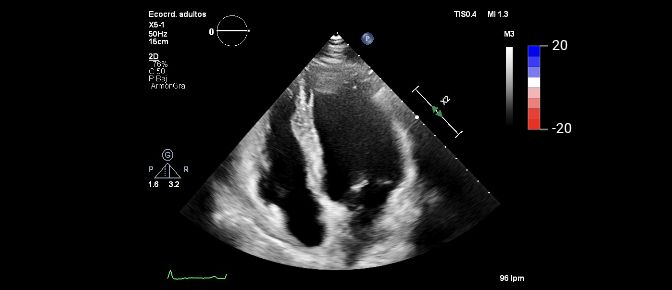
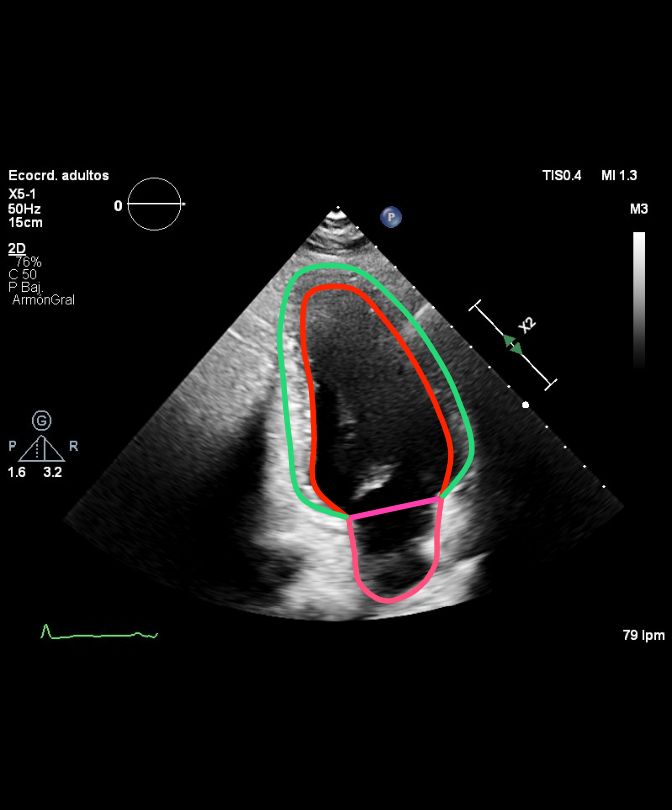
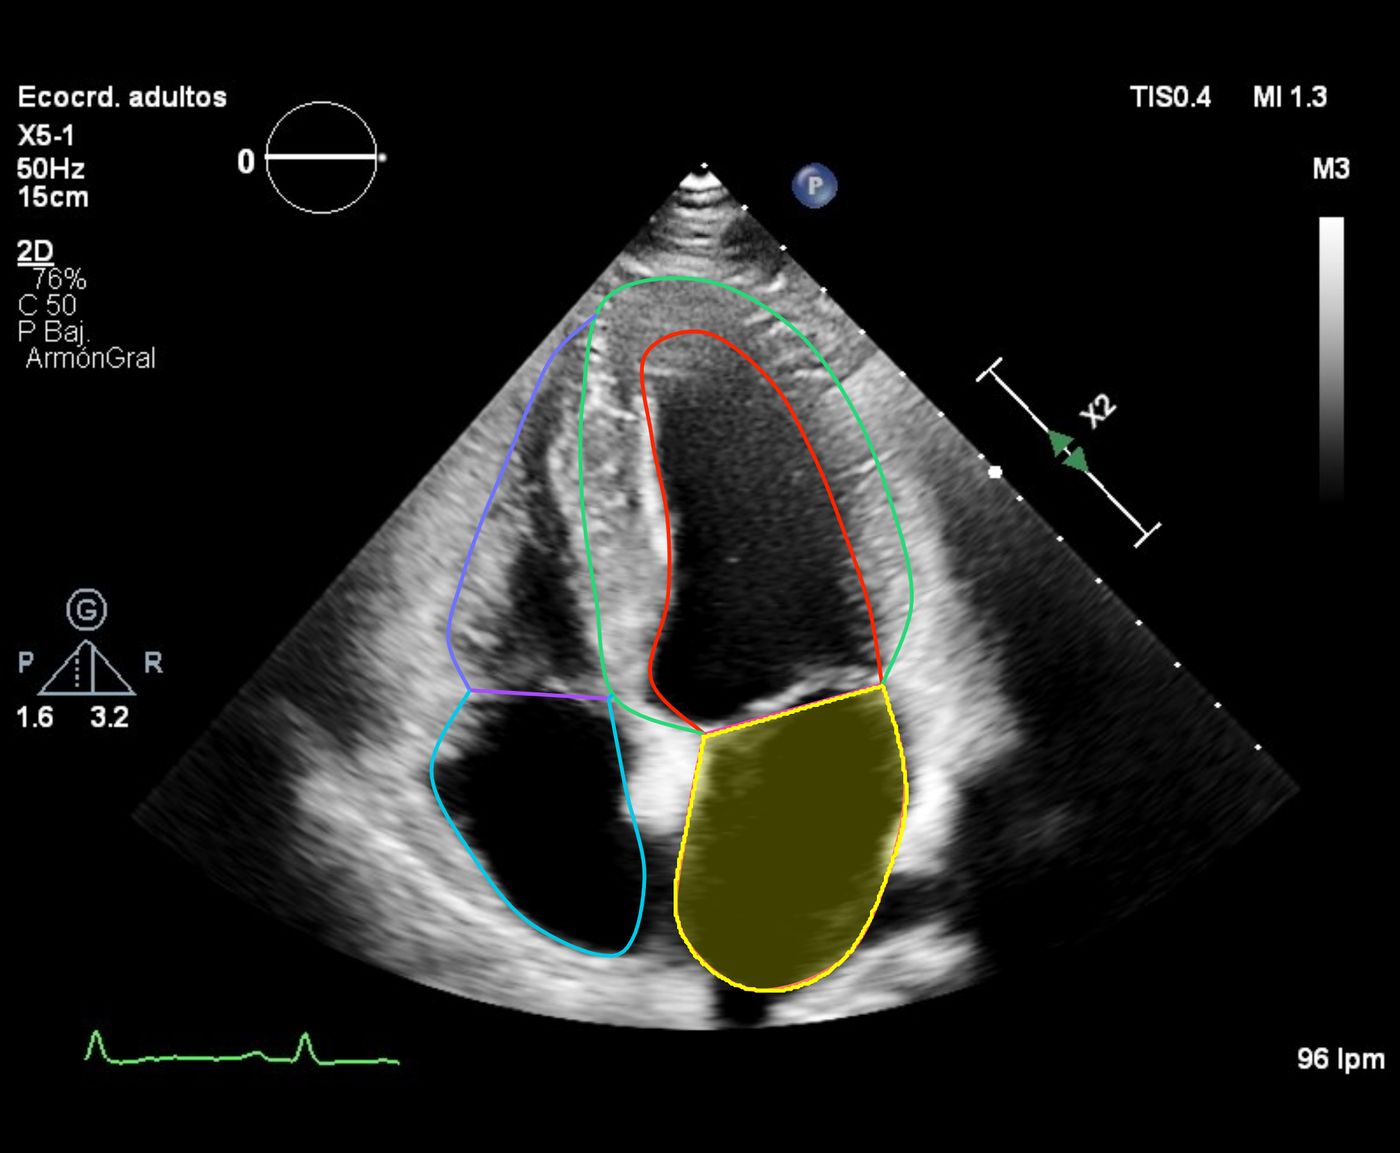
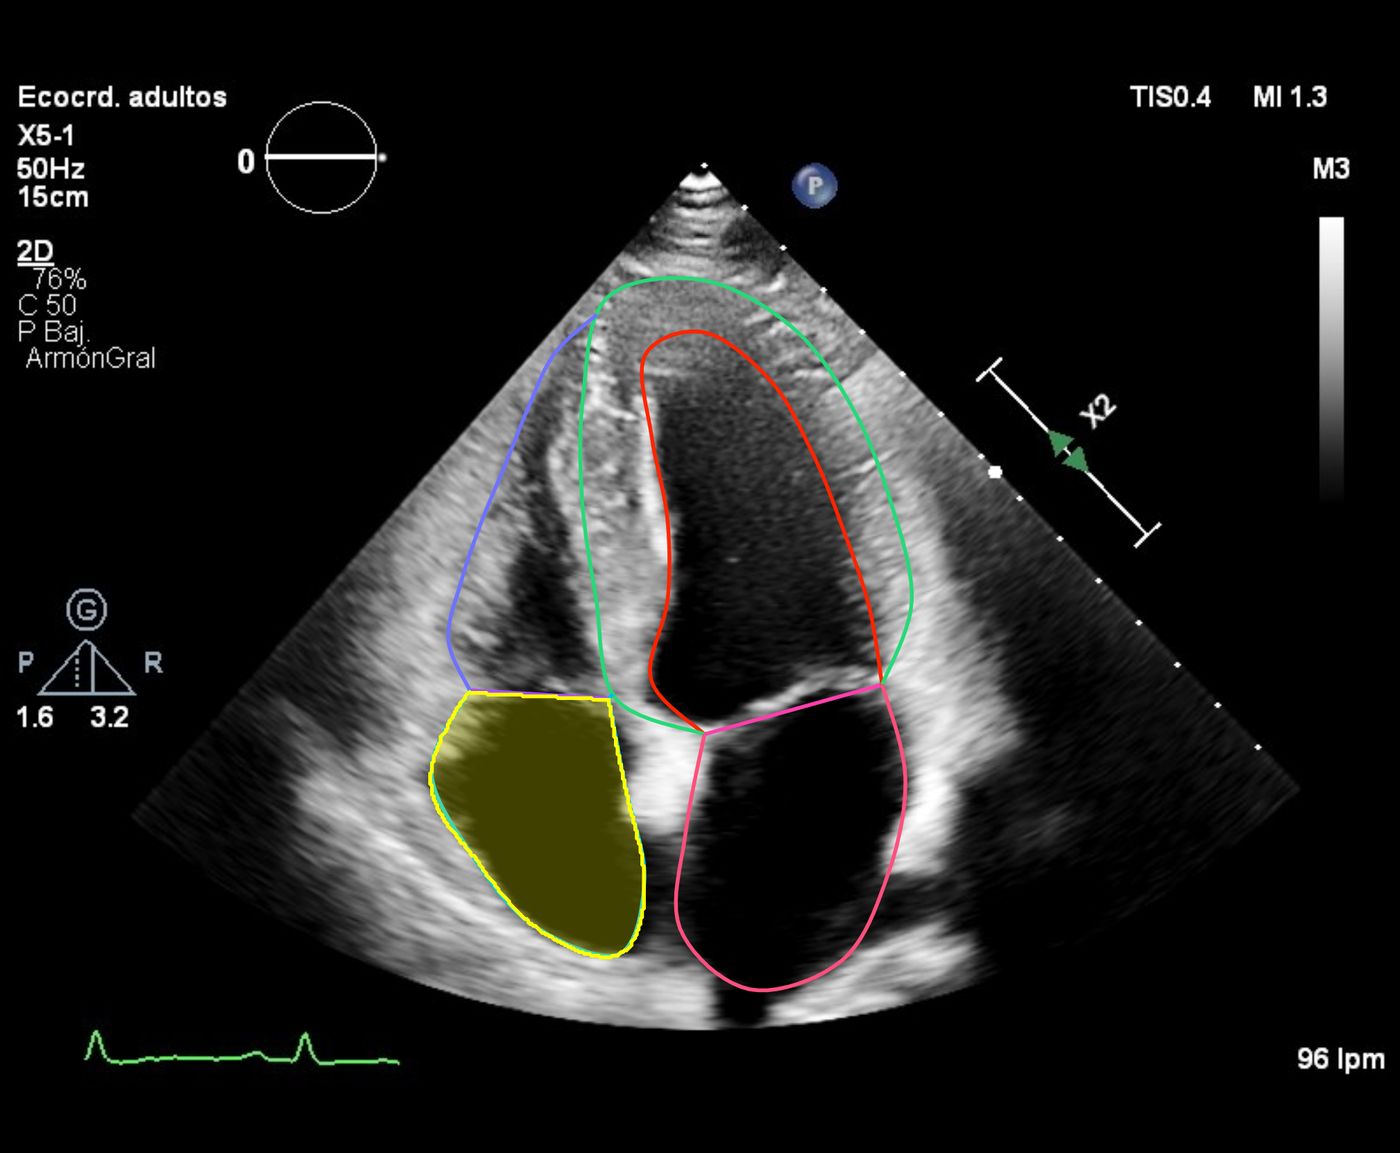
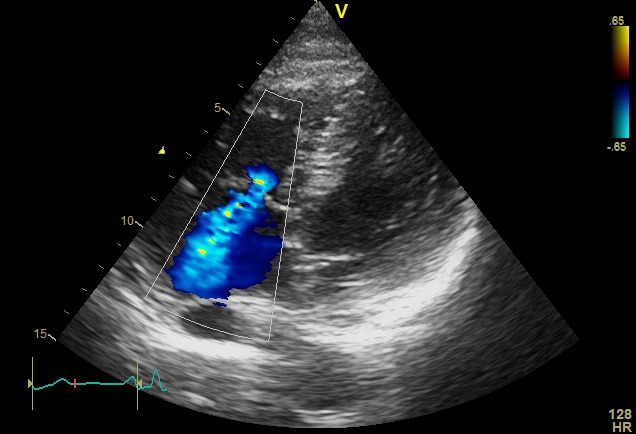
LA ESAiLeft atrial end-systolic area indexed to body surface area[A4C][Indexed]
8.86cm2/m2
Cardia analyzes the echocardiogram you have already acquired and returns a structured report that the specialist reviews, adjusts and validates.
You acquire the echocardiogram as usual. Cardia works in post-processing, without changing anything in the exam room.
Standard 2D and Doppler views with your current equipment.
Secure upload of the DICOM study, or sync from your PACS.
Automated segmentation and measurement on the study views.
Done by Cardia
Report by chamber and valve, with B-mode, Doppler and Strain and their ranges.
Done by Cardia
The specialist reviews, adjusts as needed and validates.
Measuring a study and writing its report by hand takes about 12 minutes of specialist time, according to two independent studies. Cardia does the same work in under 3 minutes from receipt of the DICOM. The specialist then reviews and validates.
About 9 minutes of specialist time freed up per study
12minutes2
Specialist, by hand
under3minutes
Cardia, automated
Between observers, key metrics vary by up to 15%: same patient, different figures depending on who measures. Cardia always measures the same way.1
Three readersup to 15% difference
Cardia, three timesthe same figure
A single report brings together 2D B-mode, Doppler and Strain, organized by chamber and valve, just as a specialist goes through a study when reading it.
Every value, against its range. Each measurement is graded against the reference ranges of the clinical guidelines. The grade describes the figure, not the patient.
Specific to the patient. Values are indexed to body surface area and calculated automatically.
The final word. The report starts out as inconclusive and is closed by the specialist, who integrates the other clinical criteria.
Cardia measures and grades each value against the guidelines. The specialist makes the diagnosis.
8.86cm2/m2
56%
55%
2.72cm/m2
1.09cm
0.71cm
Normal-21.6 %
6.81cm2/m2
1.24cm/m2
1.96cm²
PHT 112.02 ms
1.15mmHg
1.18
E 79.75 cm/sA 77.37 cm/s
5.62
E 79.75 cm/se′ 14.19 cm/s
0.55cm
0.08
MR jet area 1.26 cm²
1.15cm
0.8
TR jet area 7.19 cm²
Ranges can follow American or European guidelines, or the center's own.
Automated when it helps. Reviewable whenever needed.
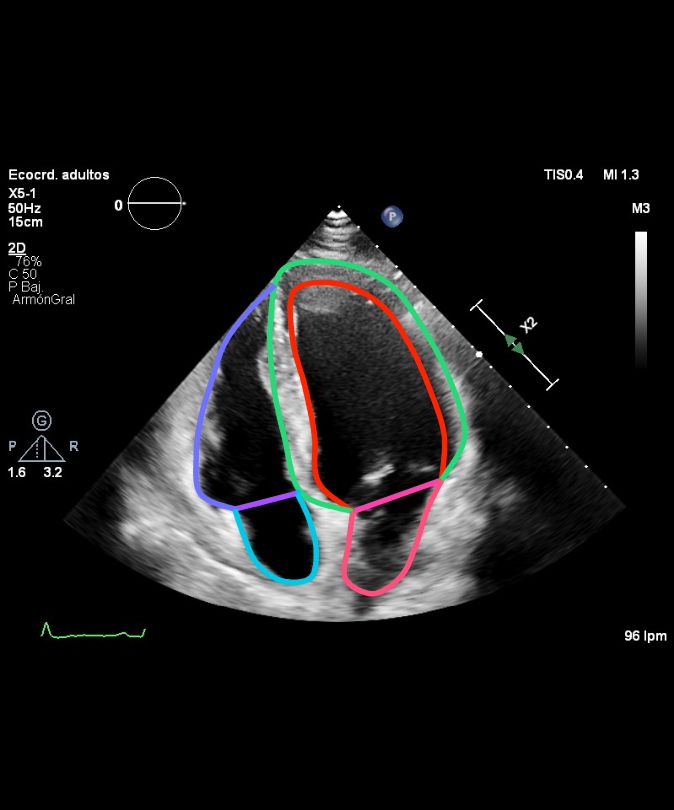
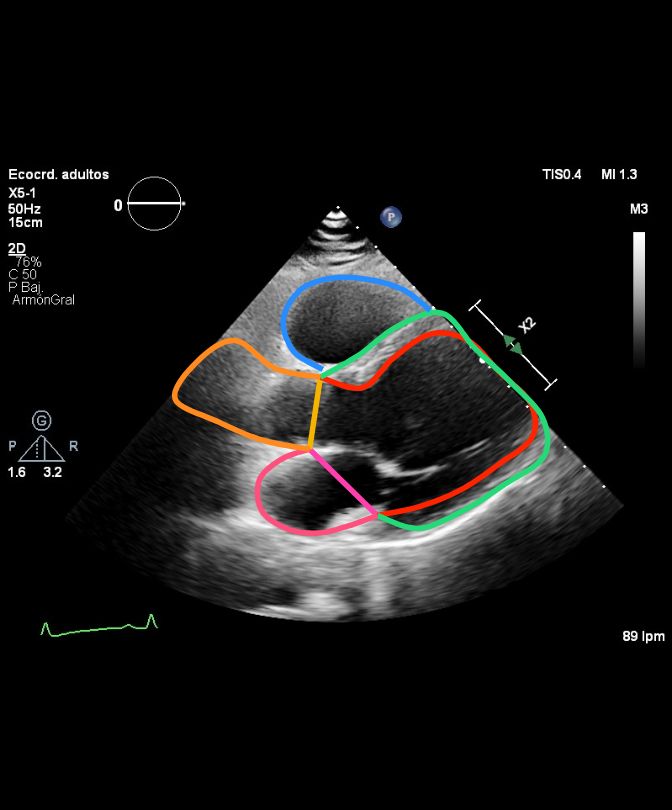
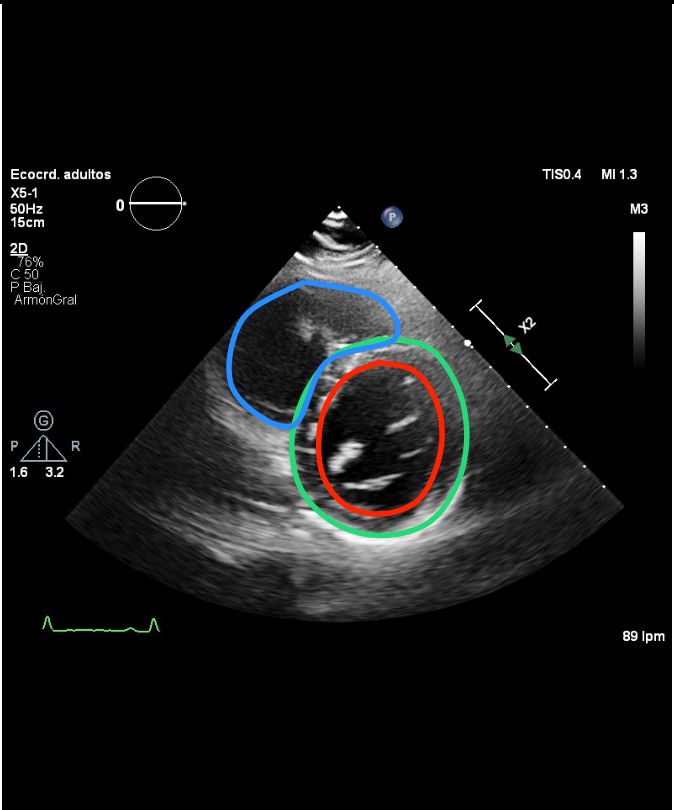
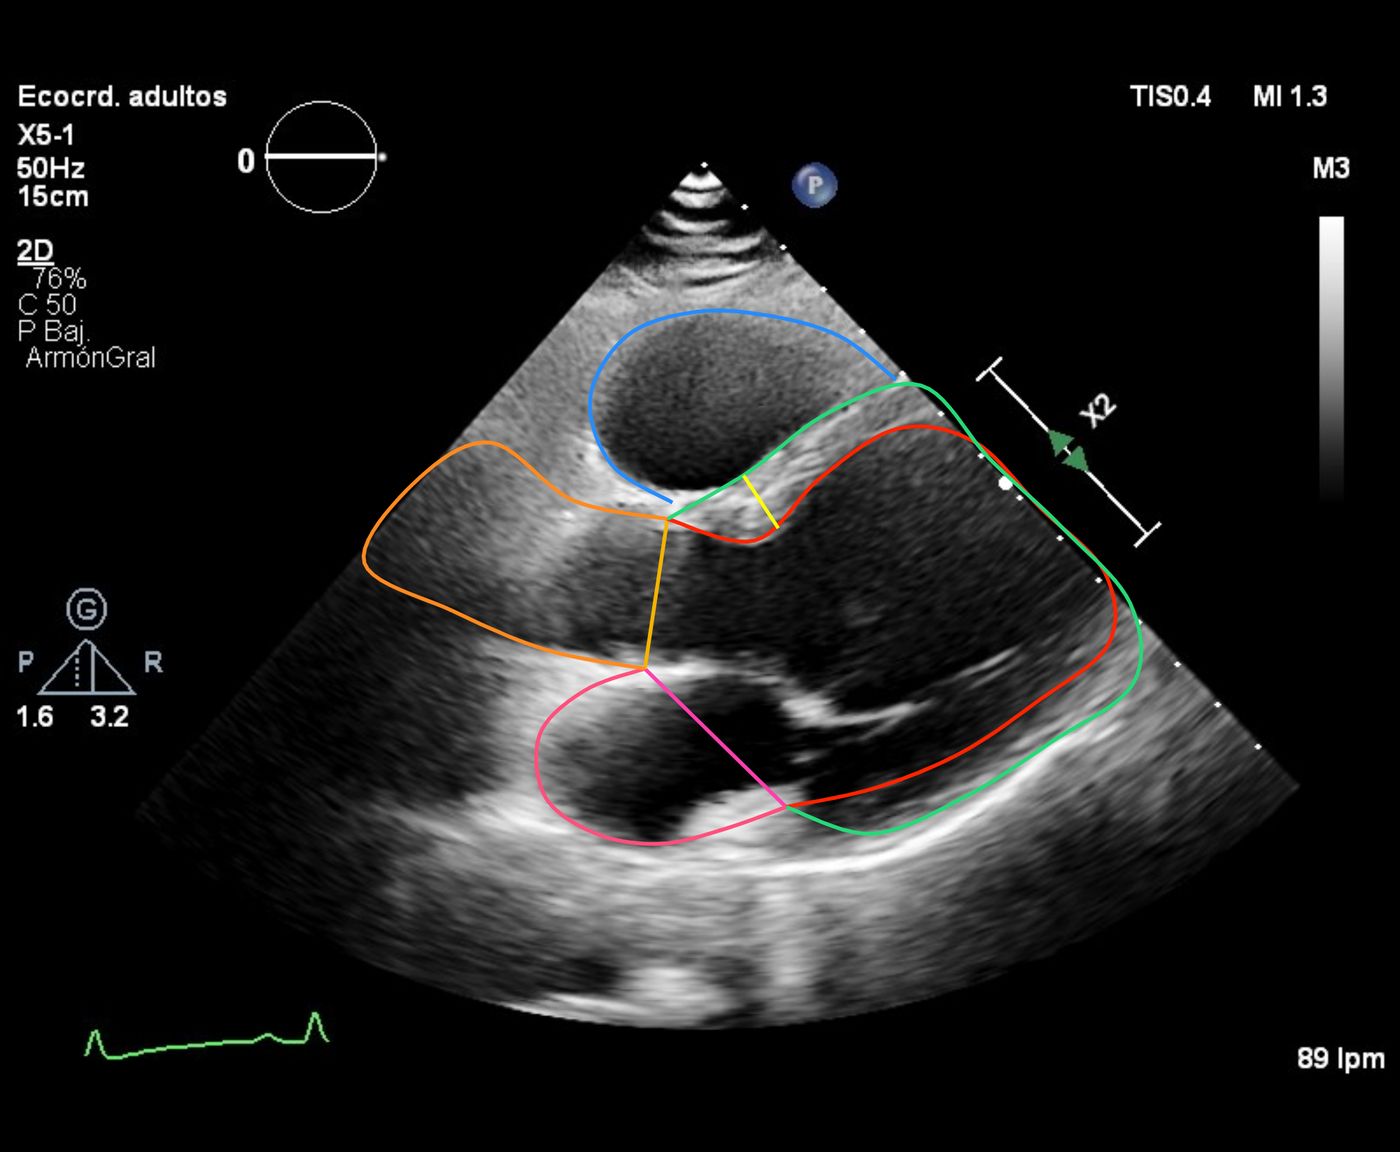
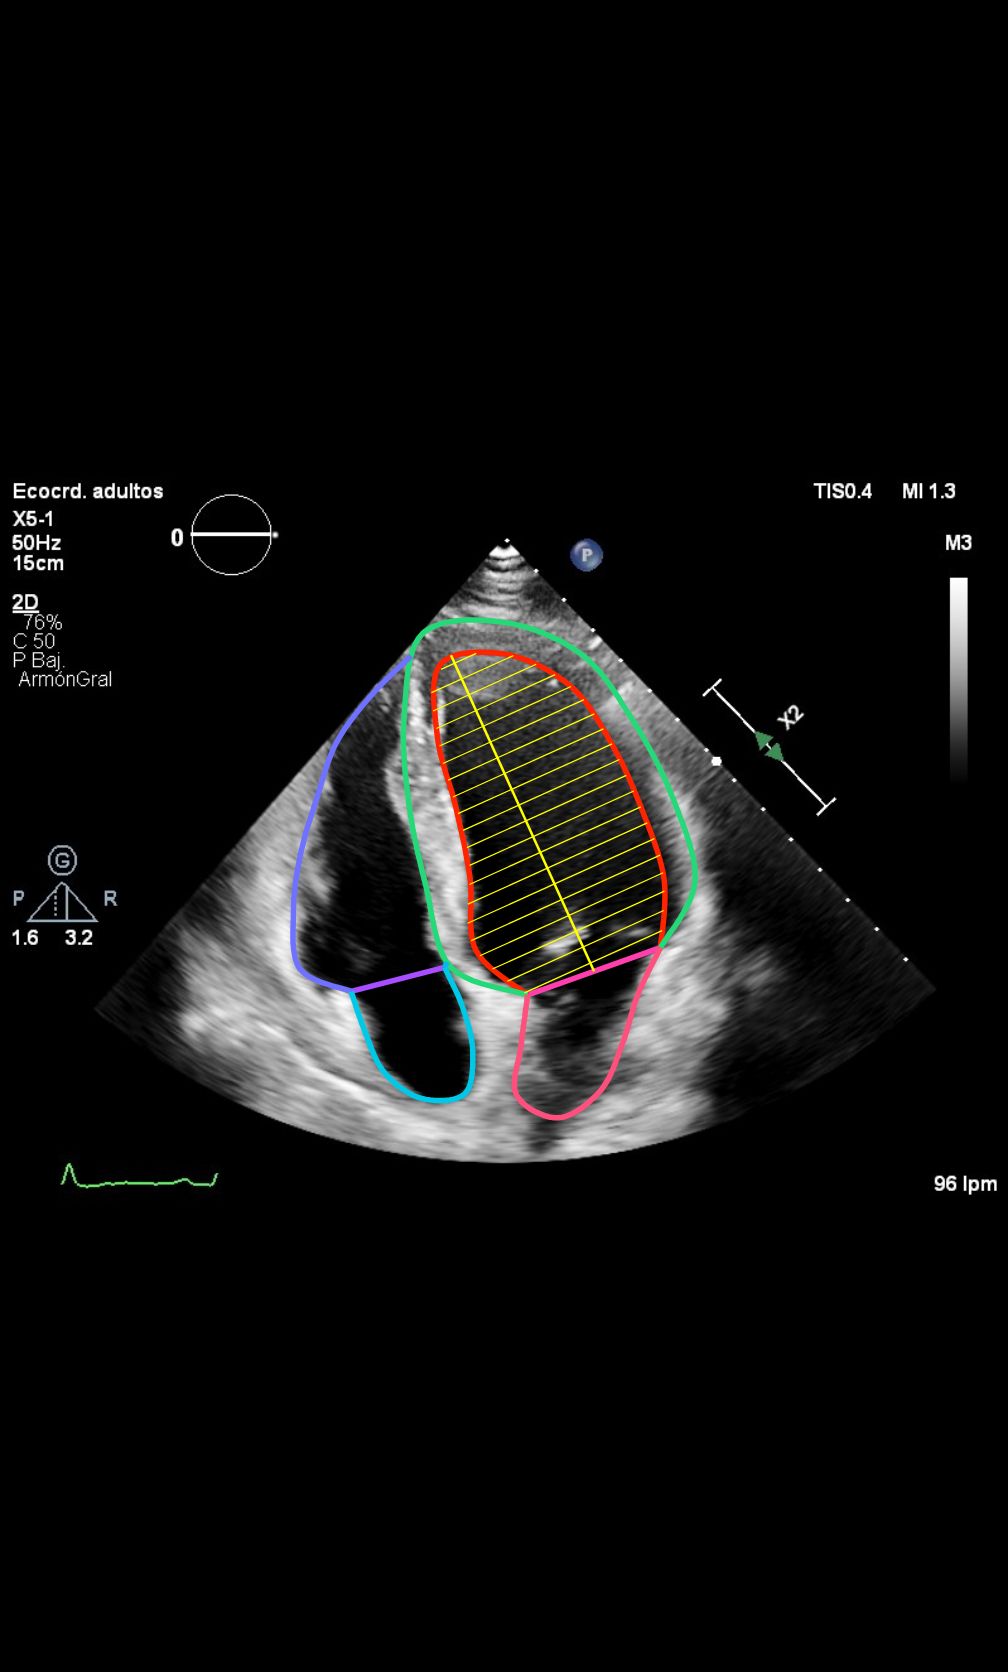
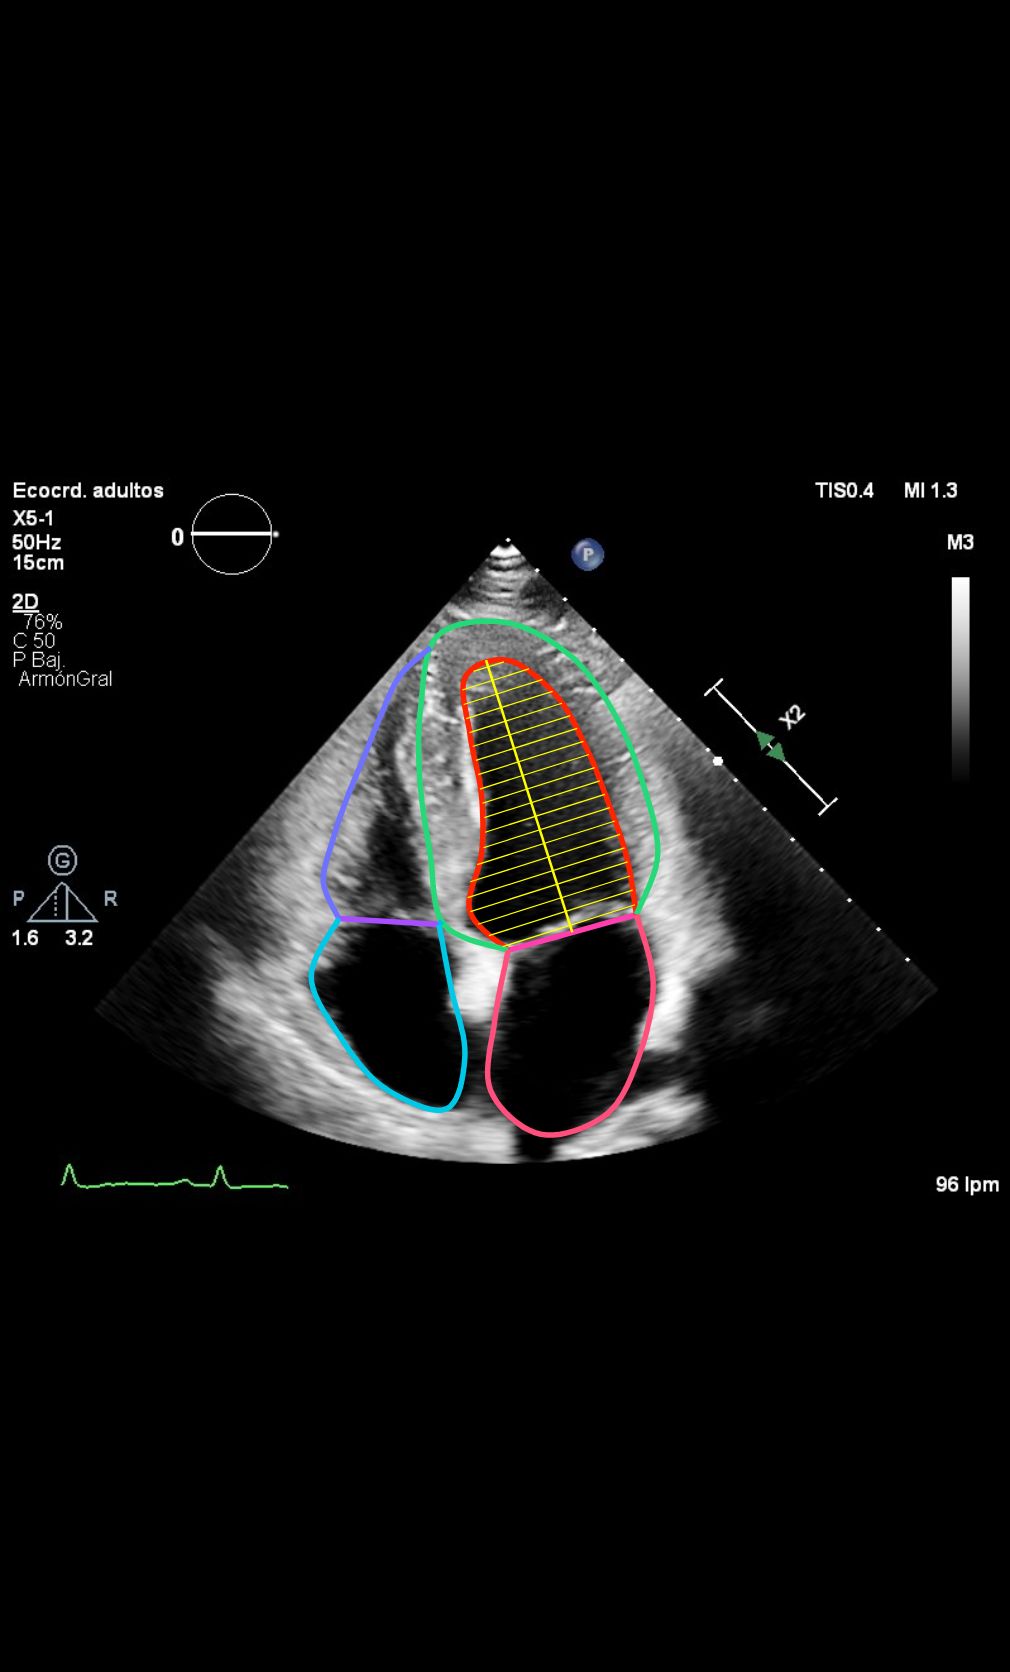
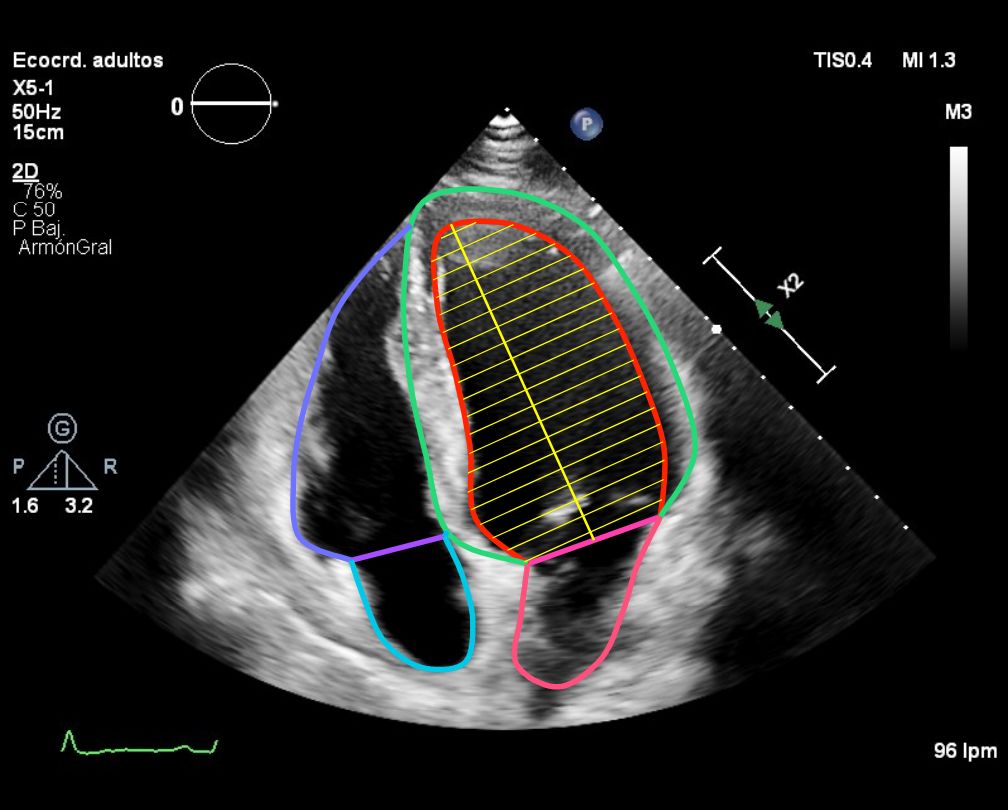
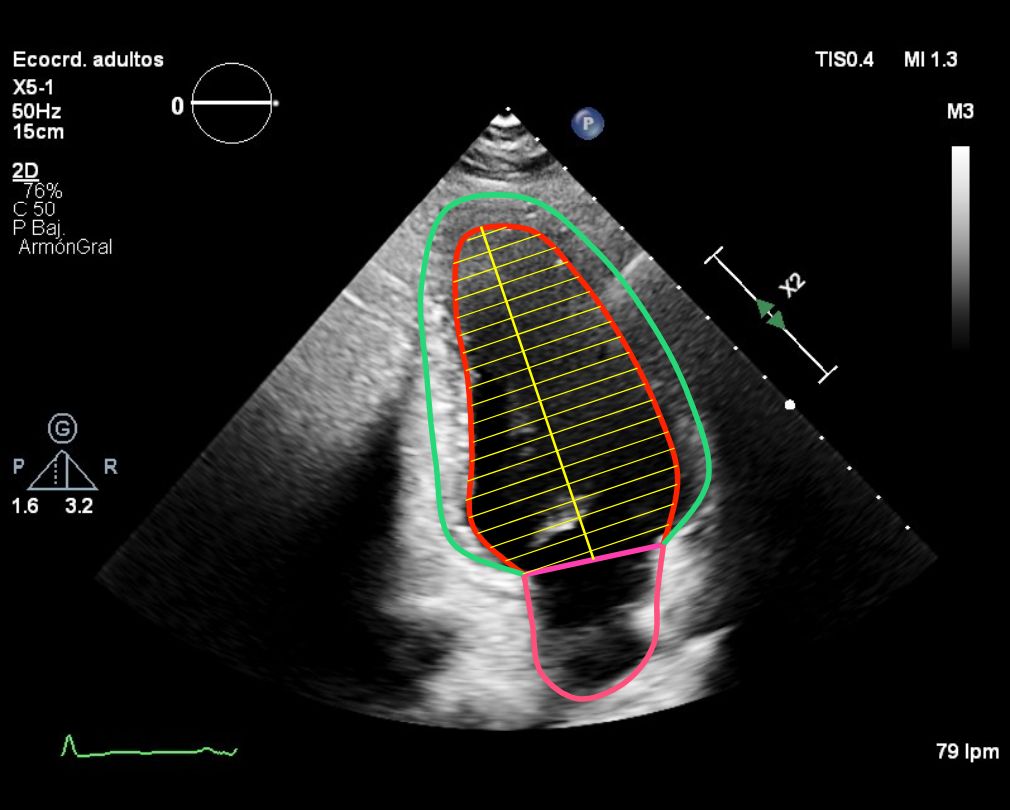
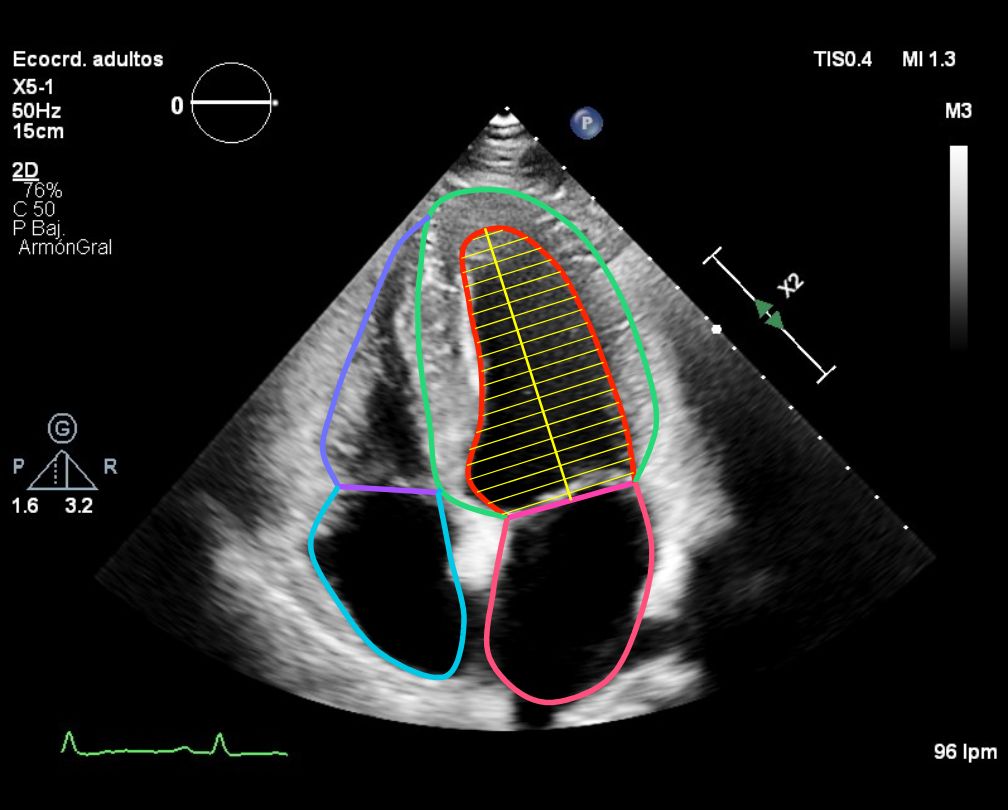
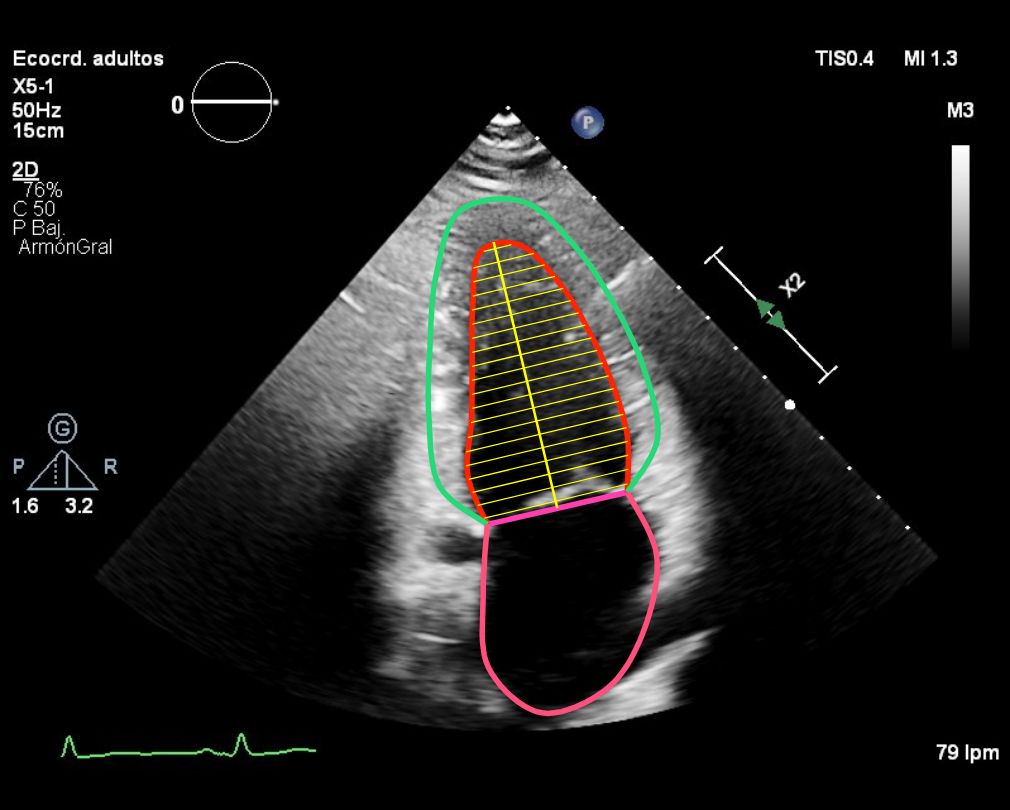
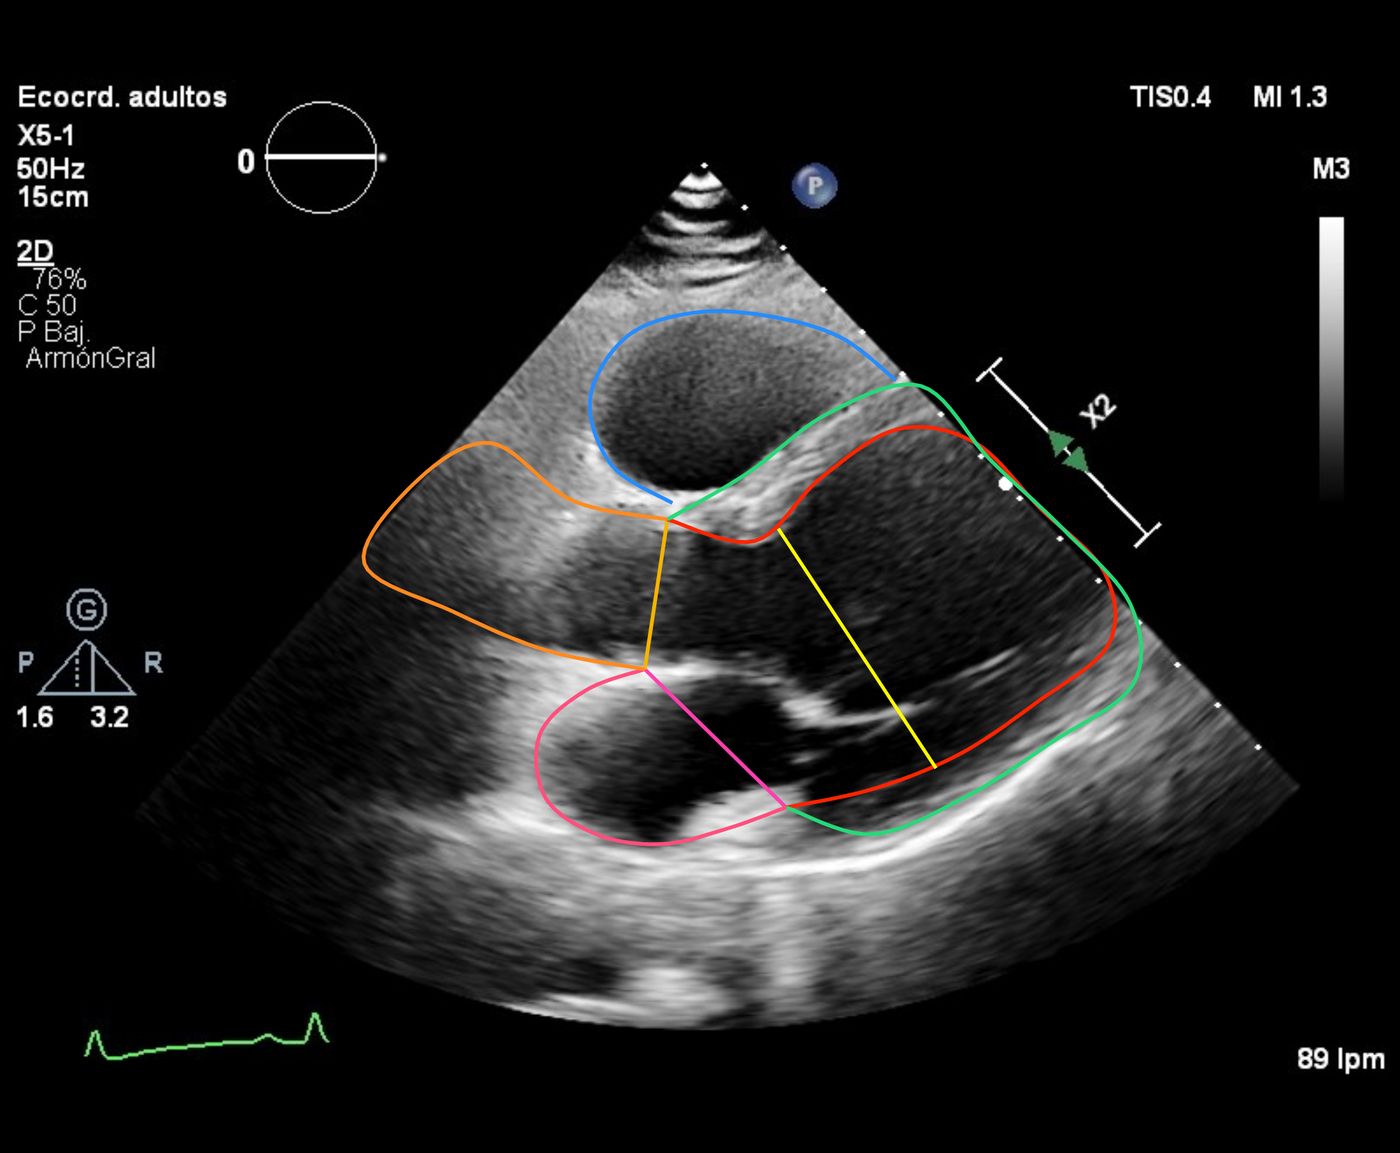
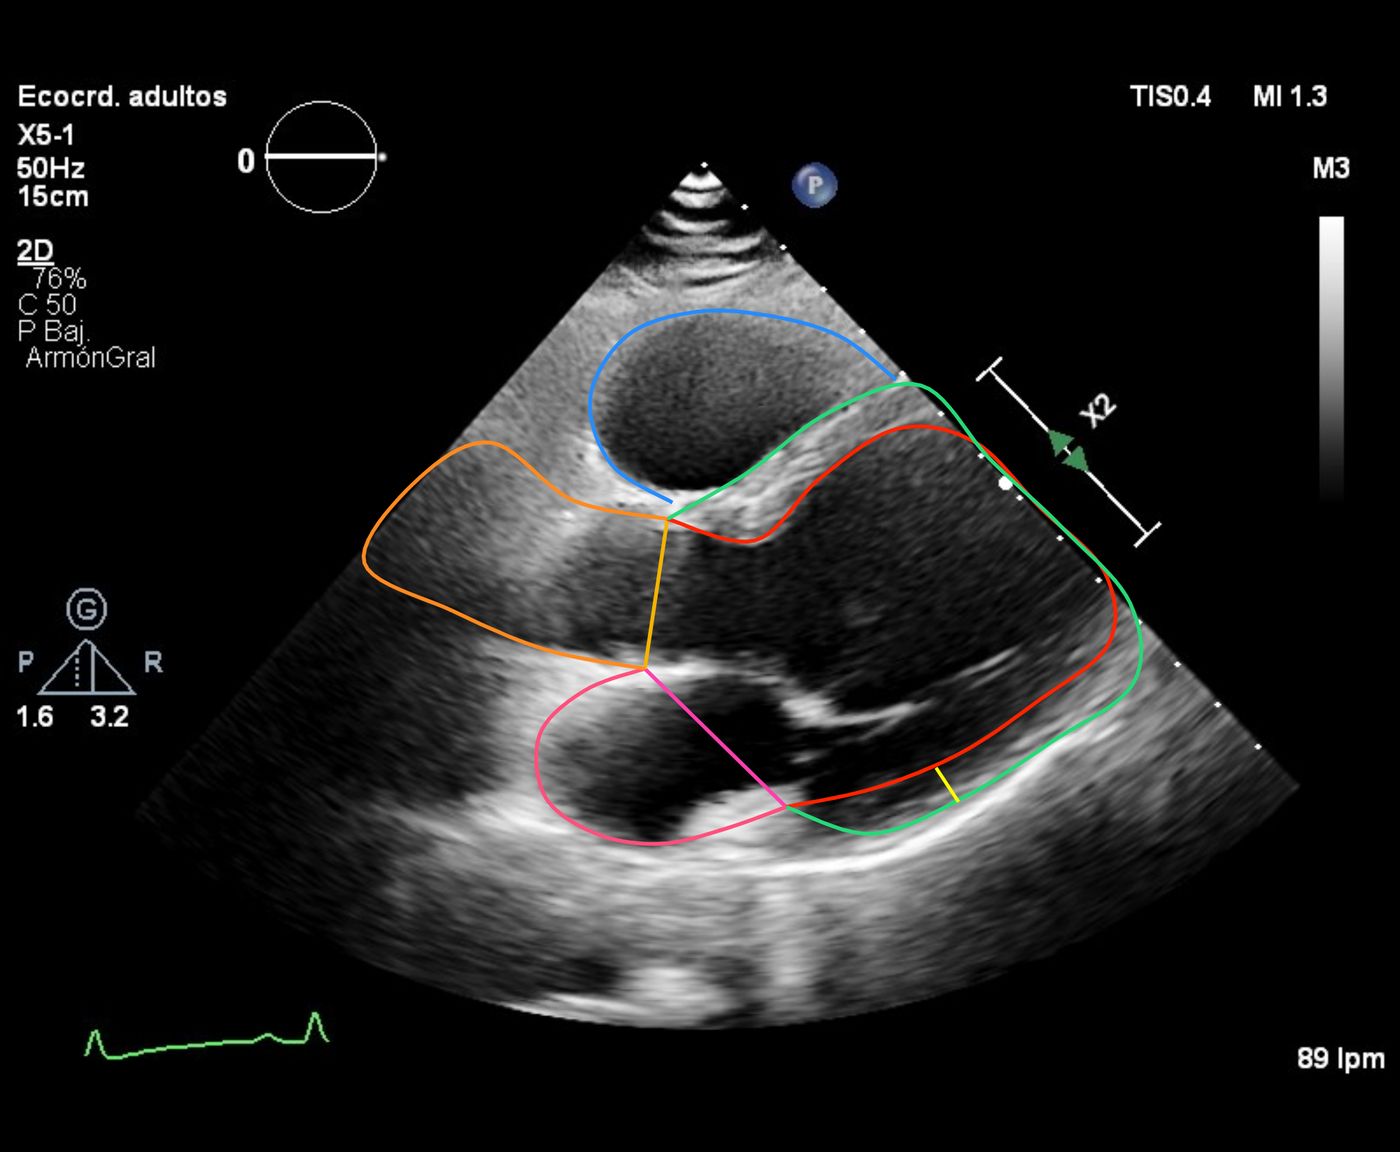
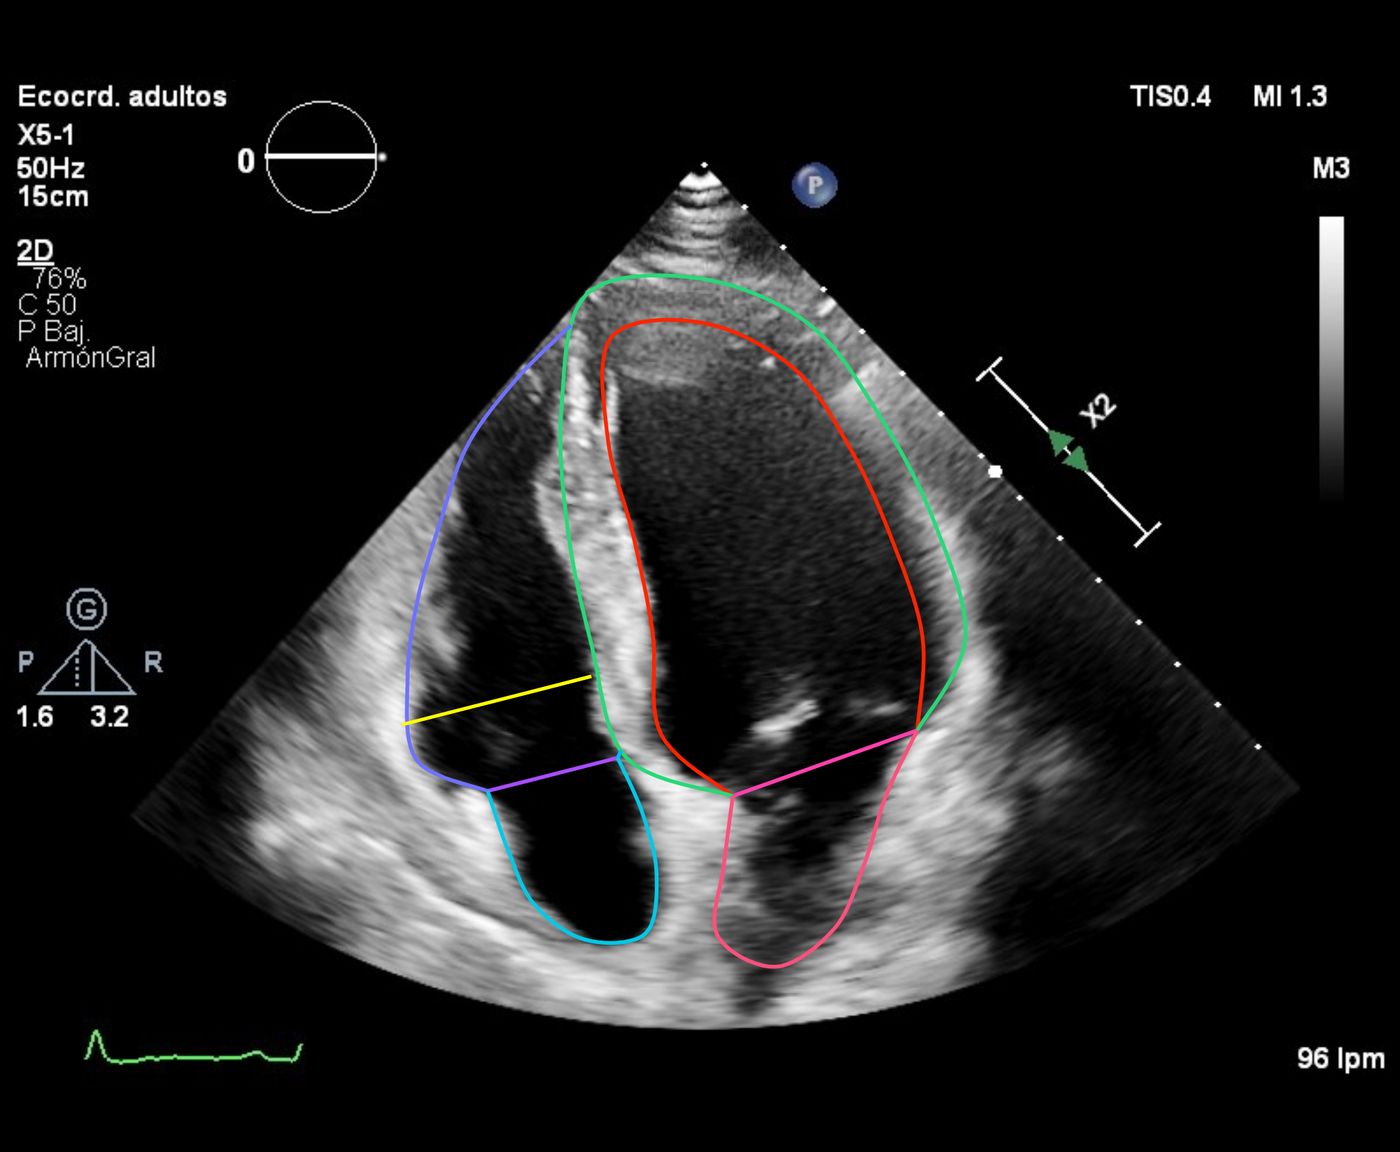
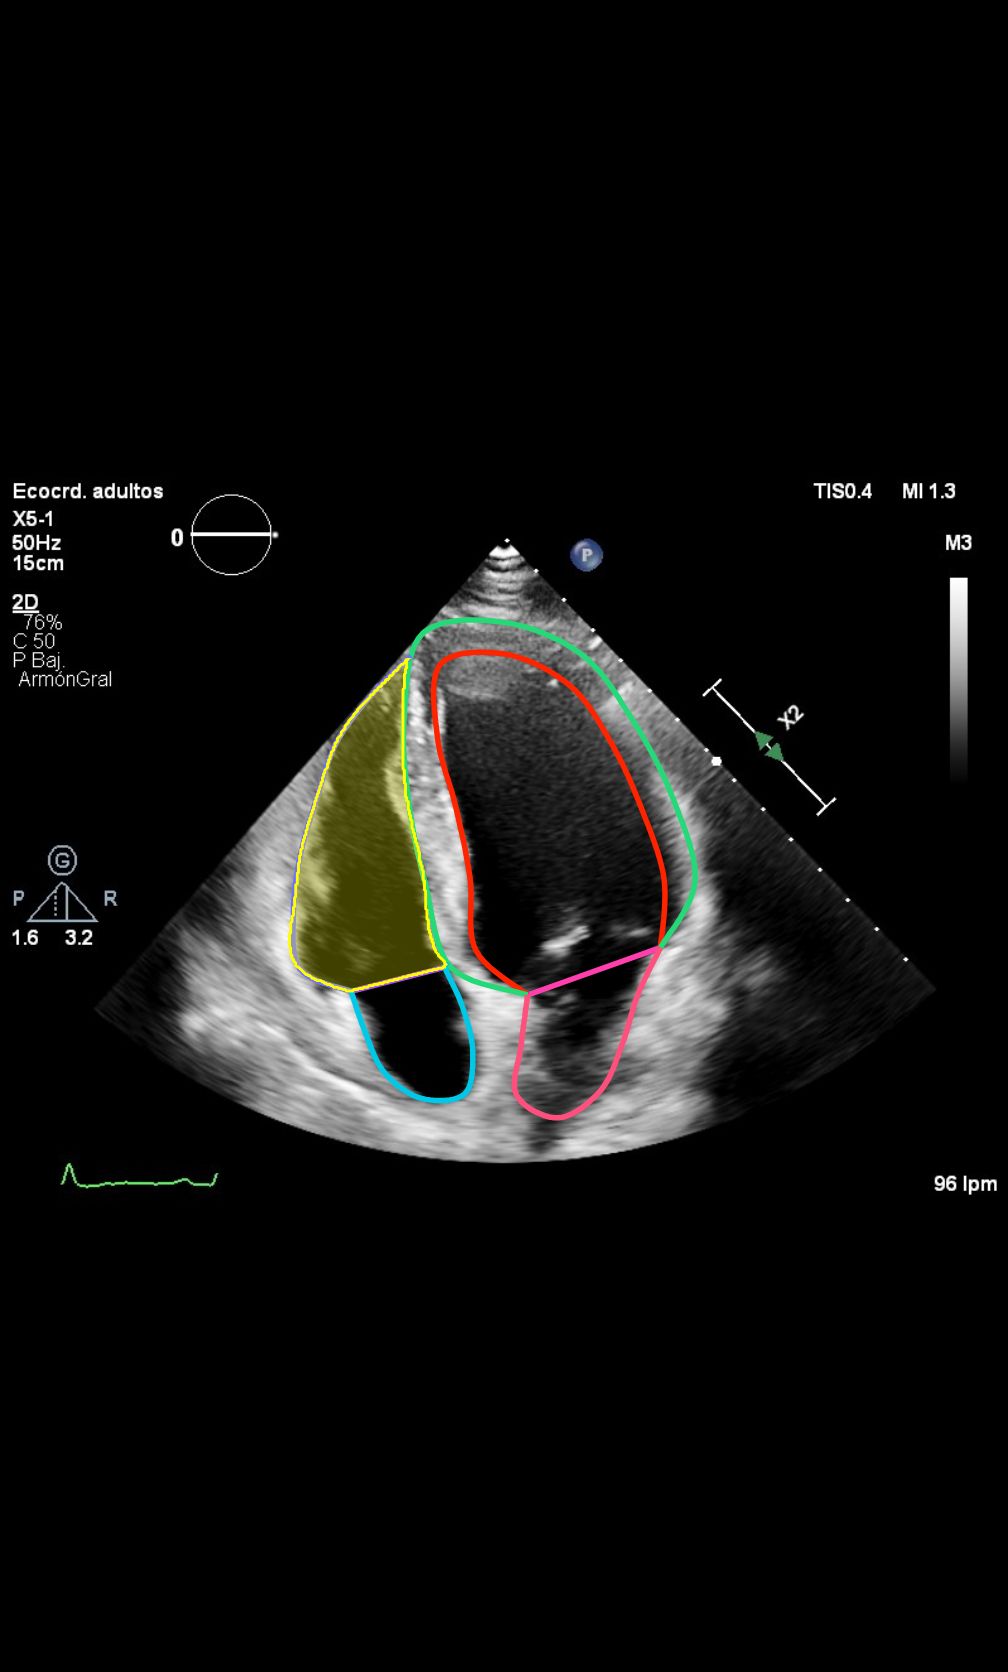
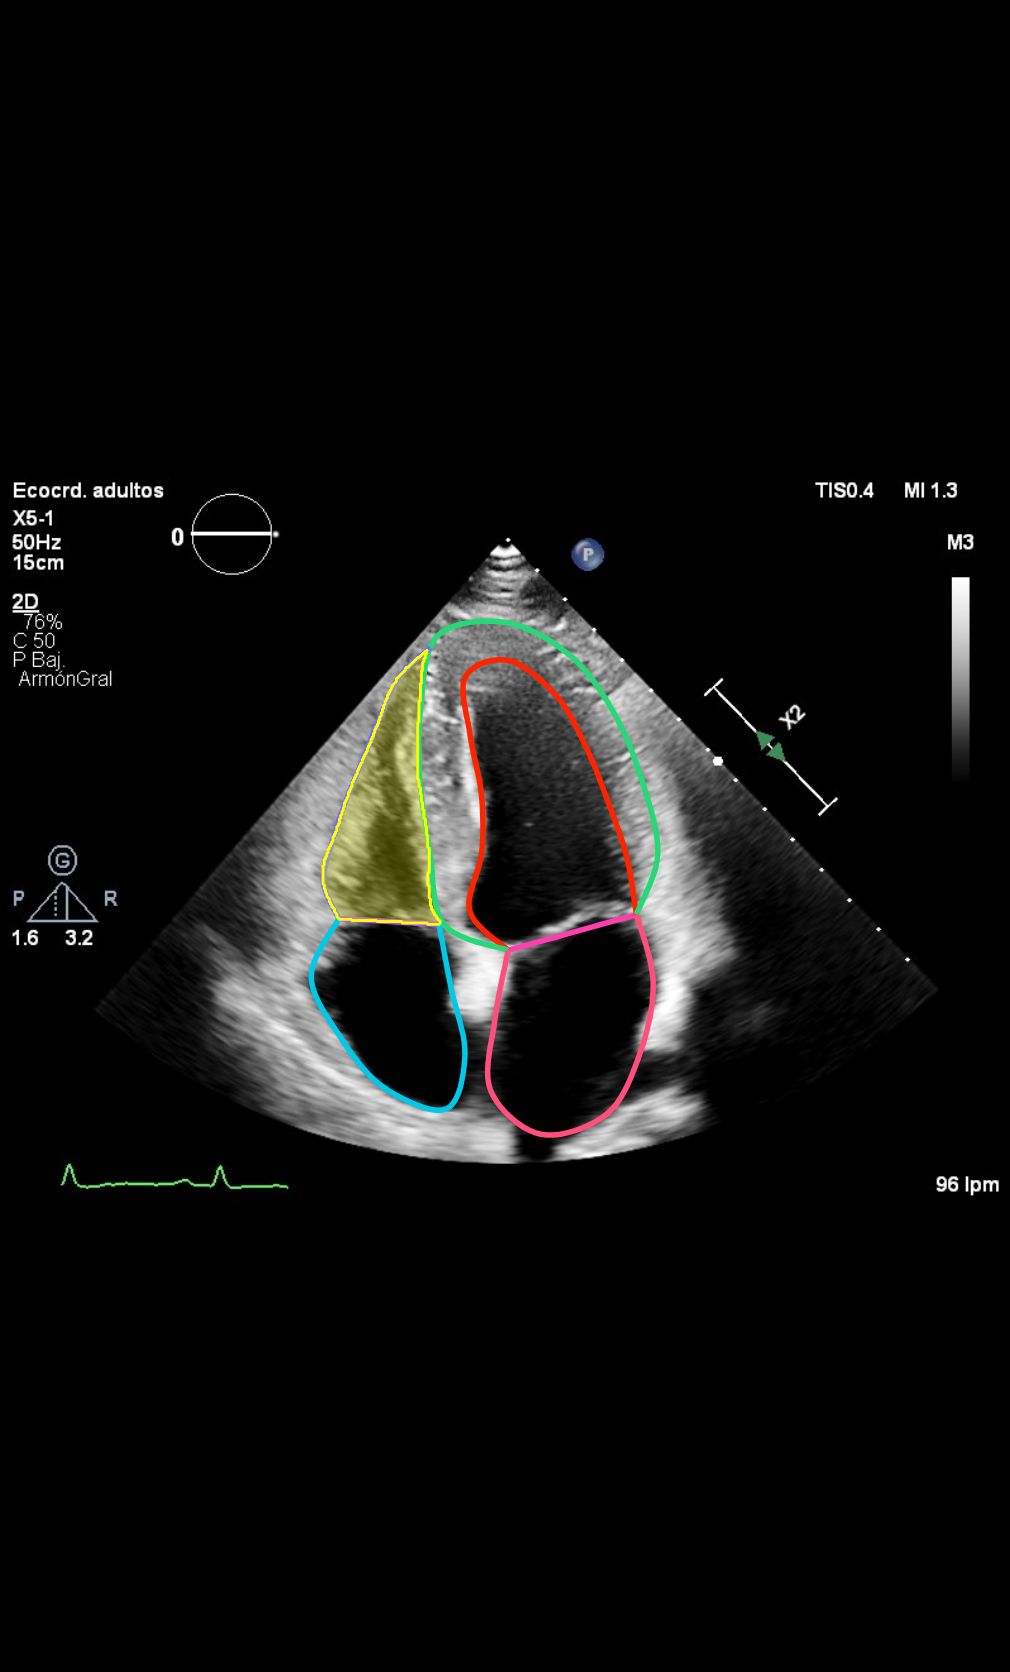
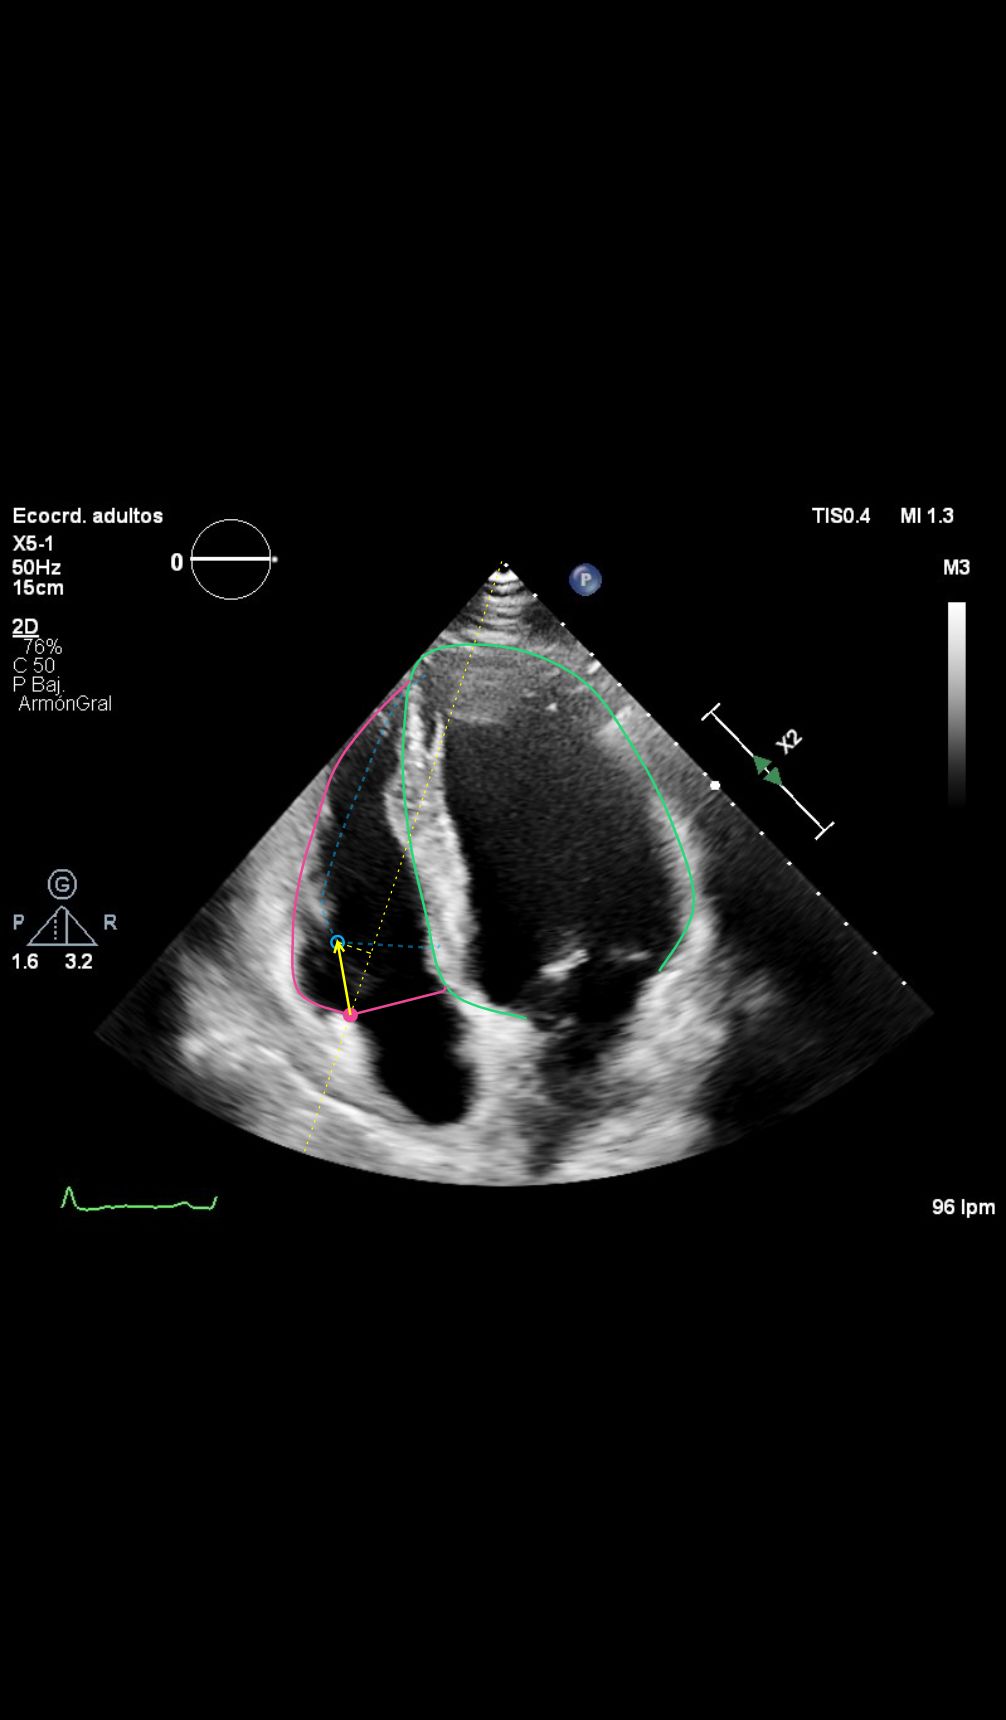
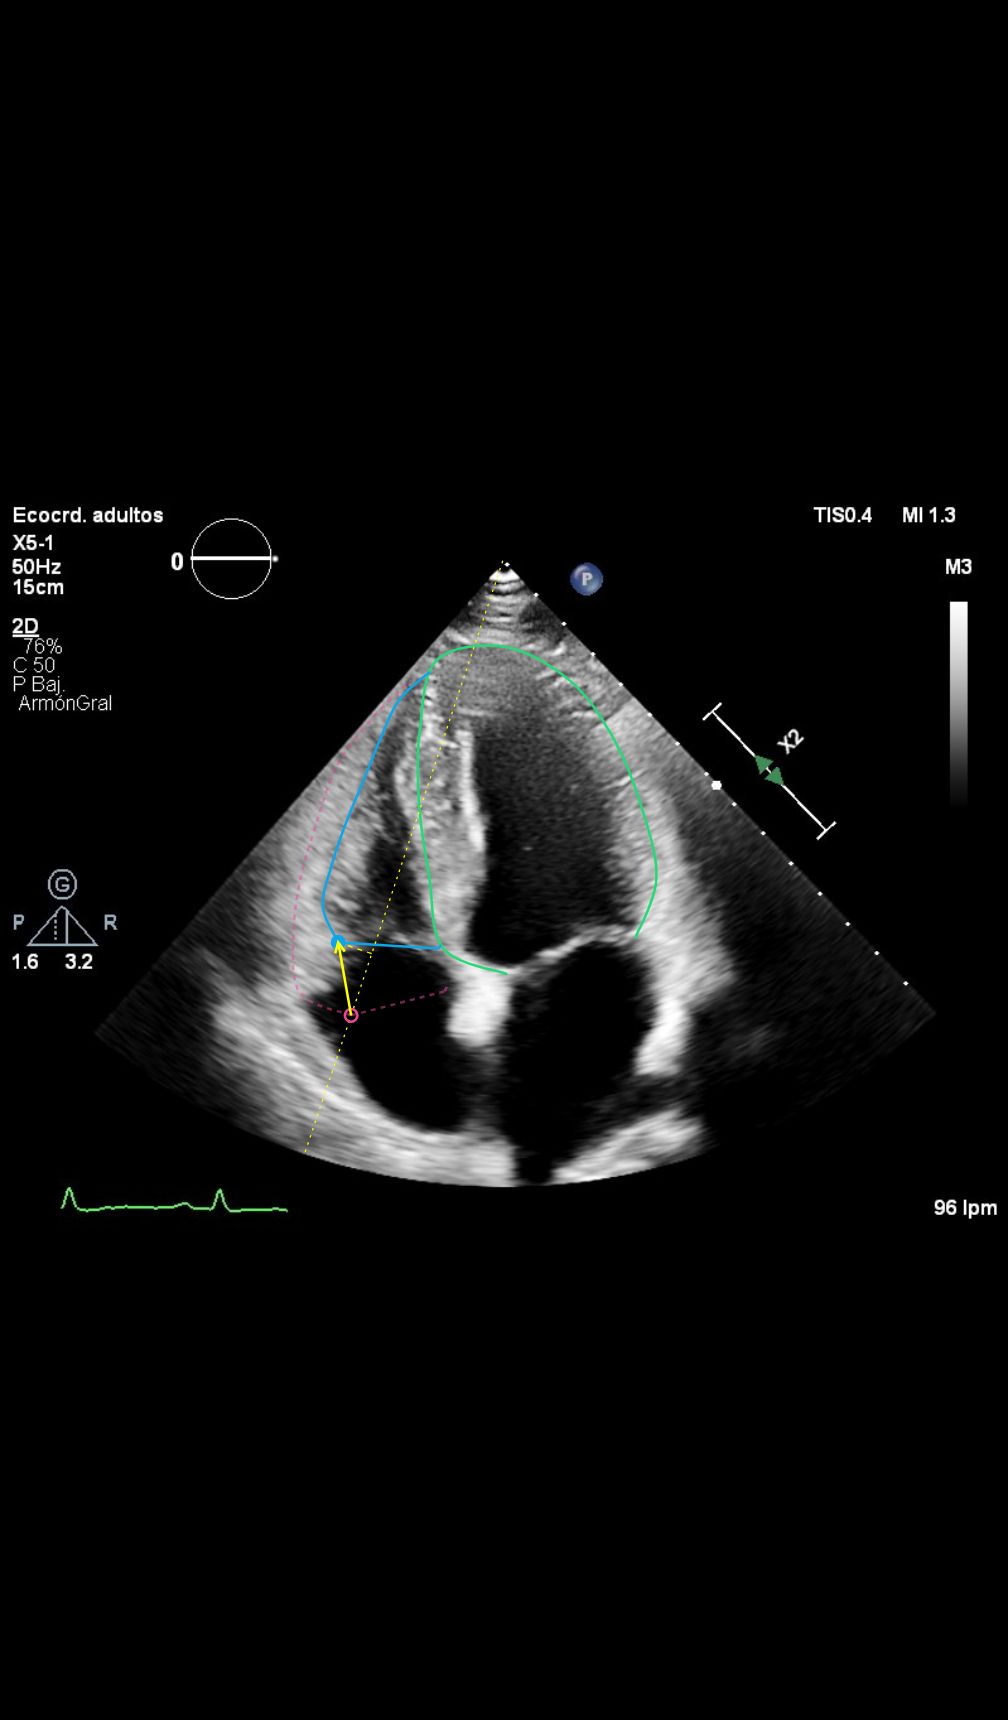
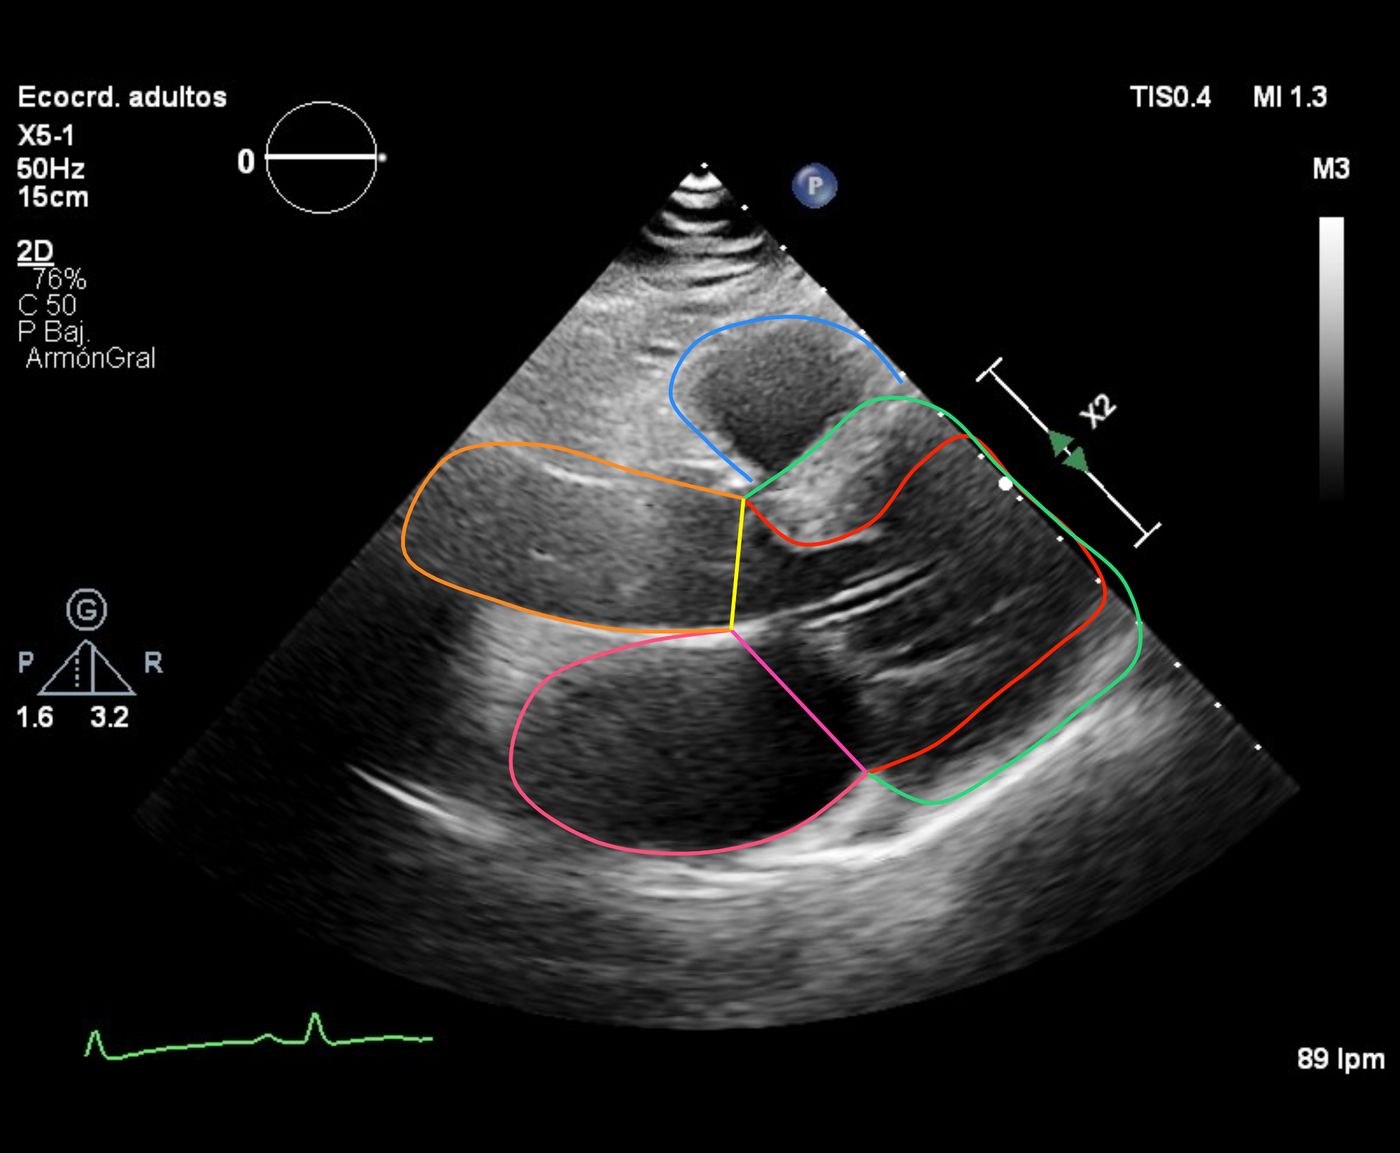
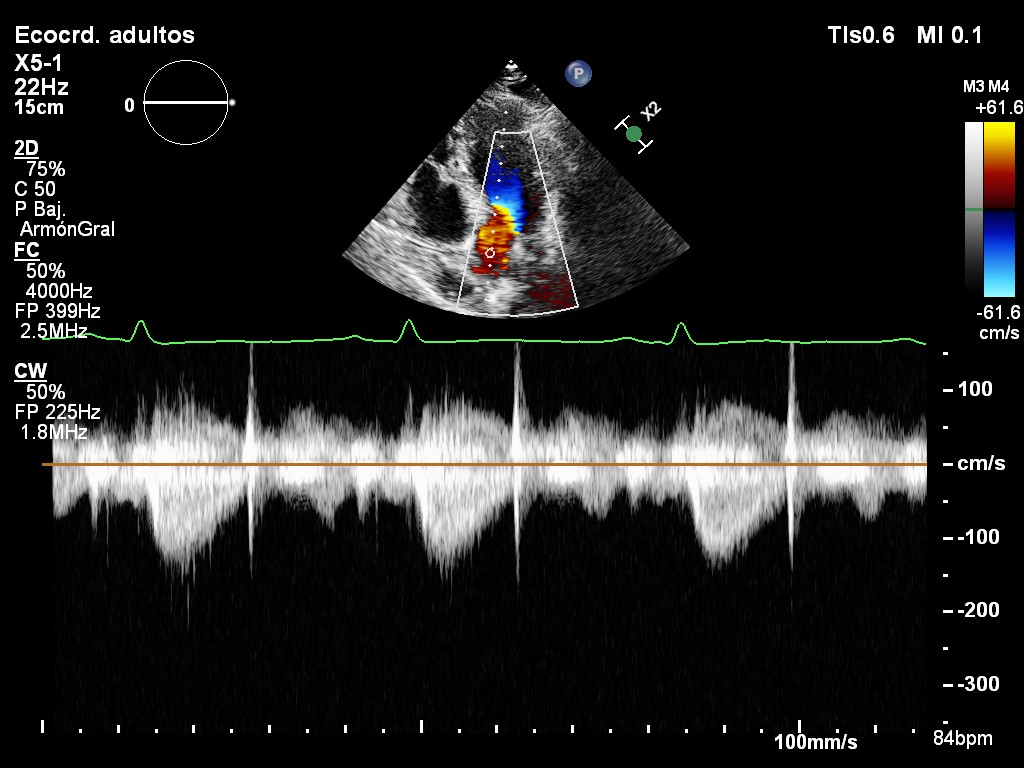
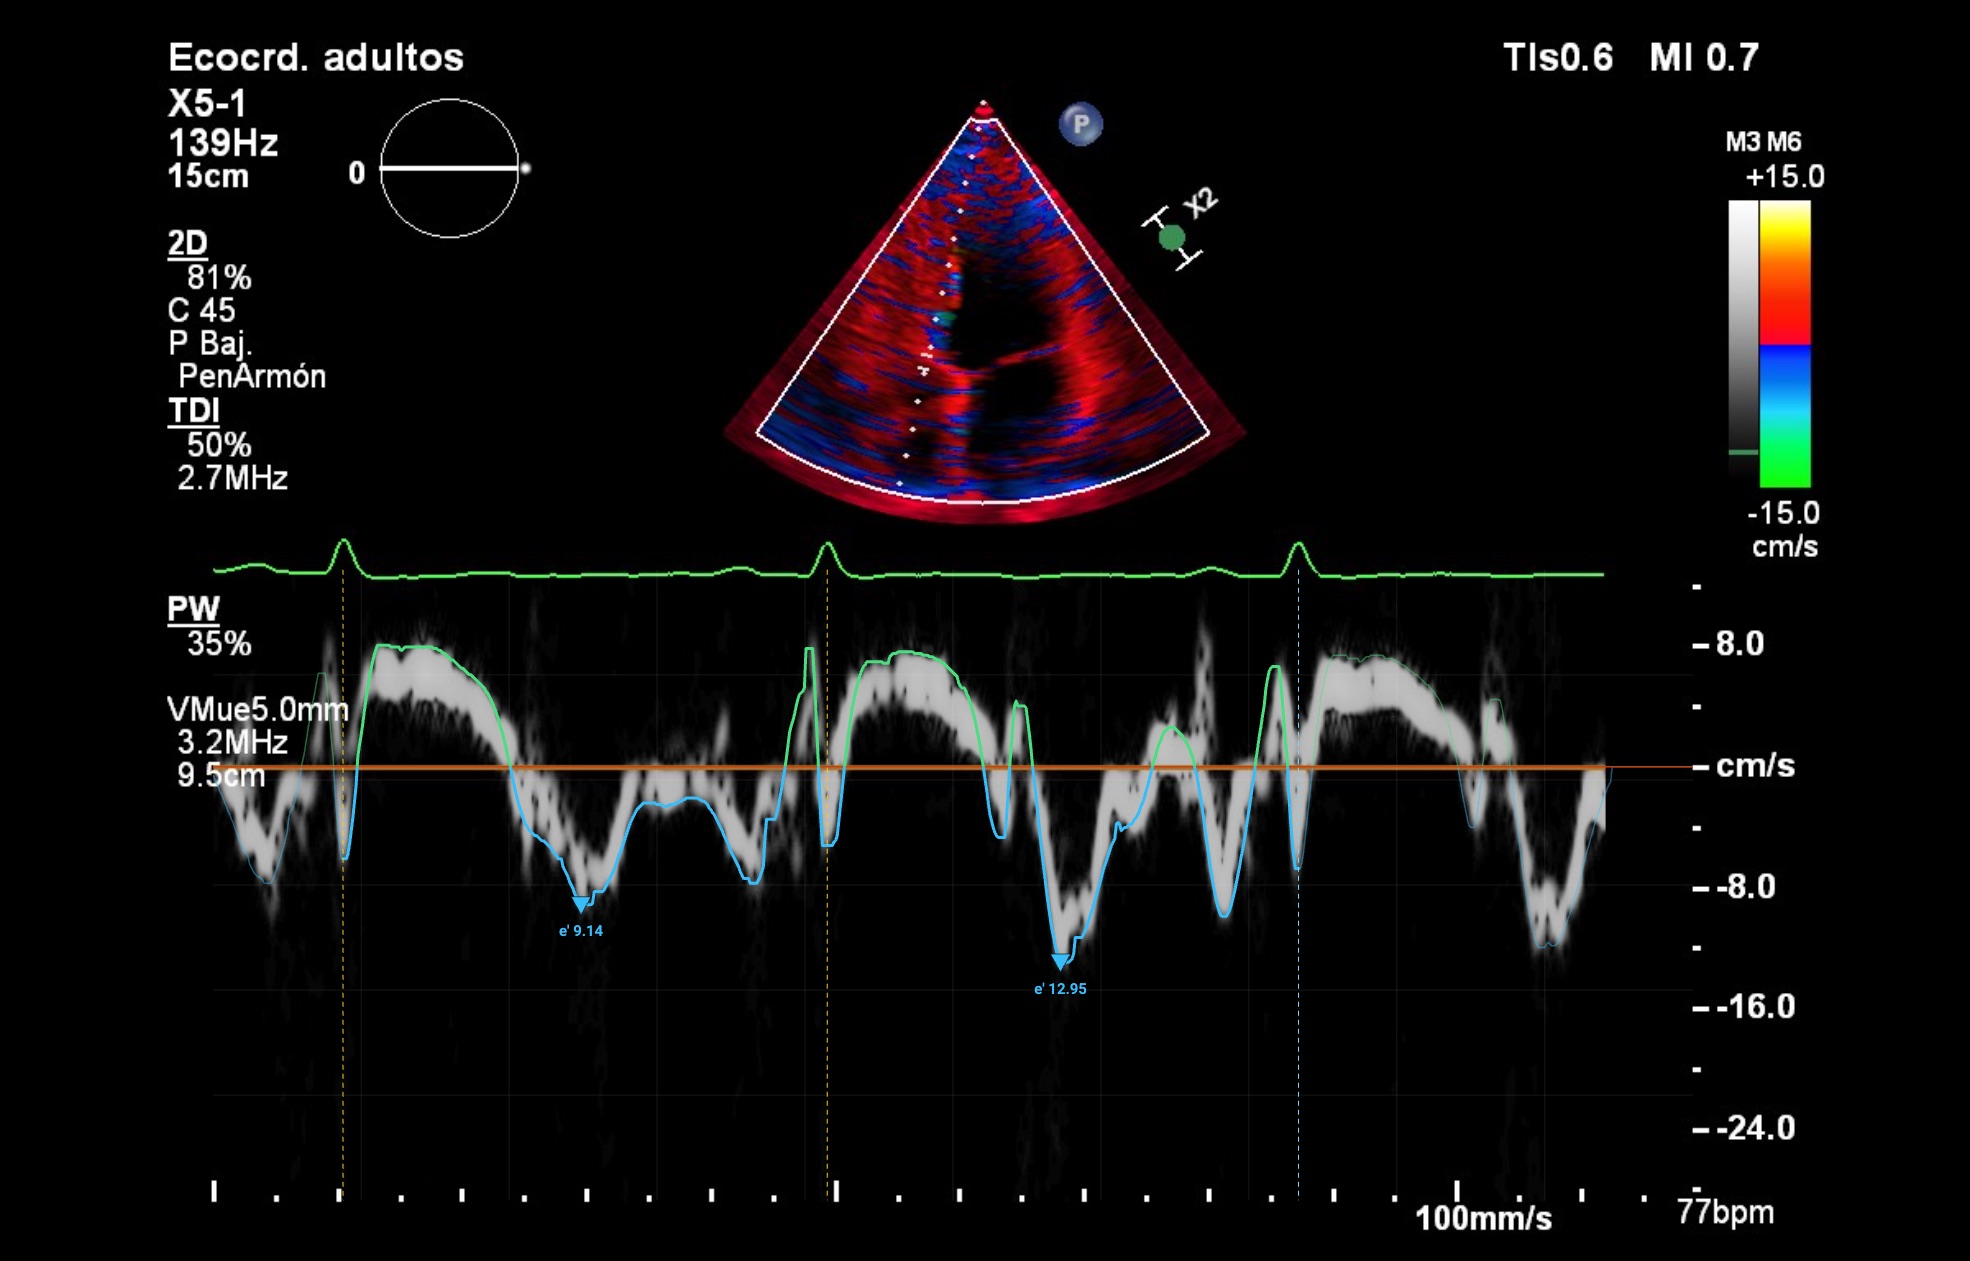
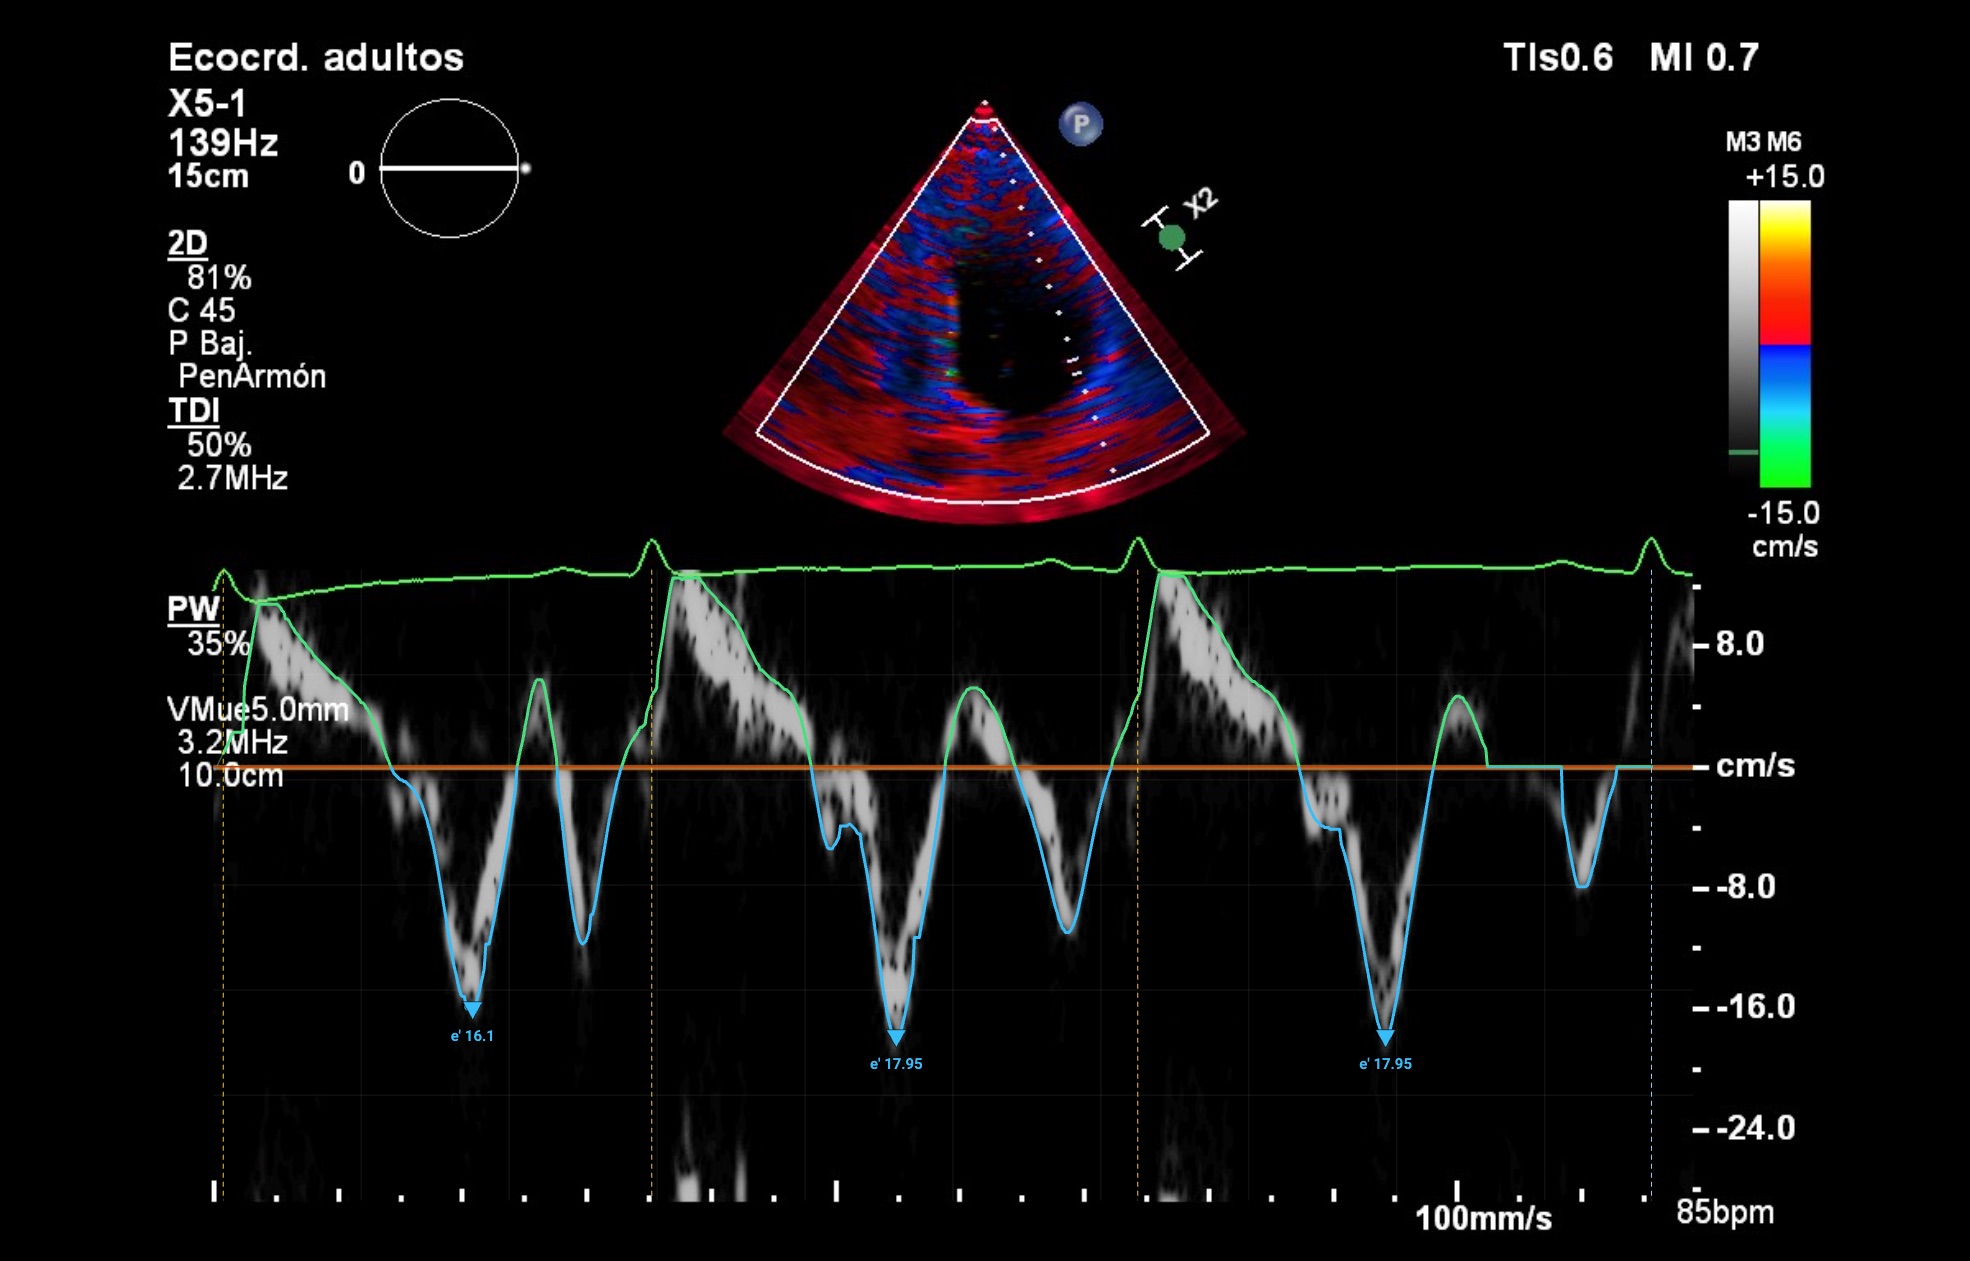
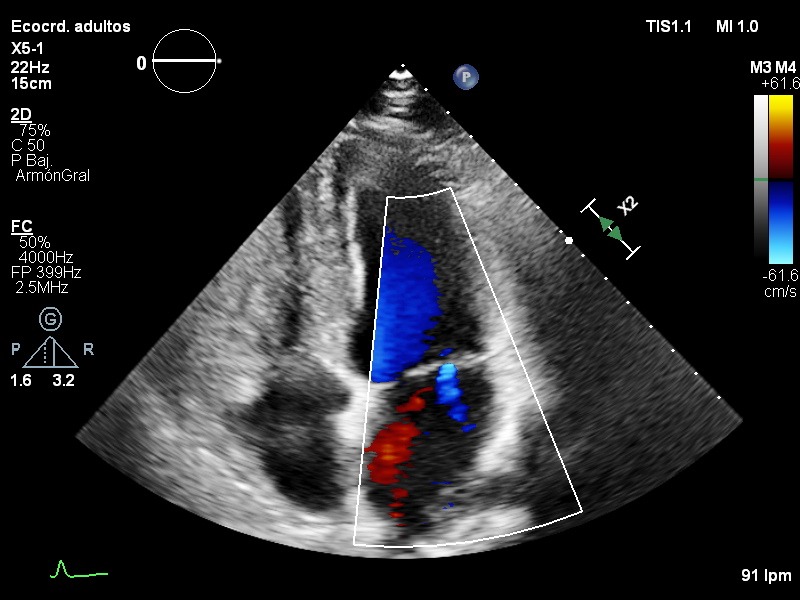
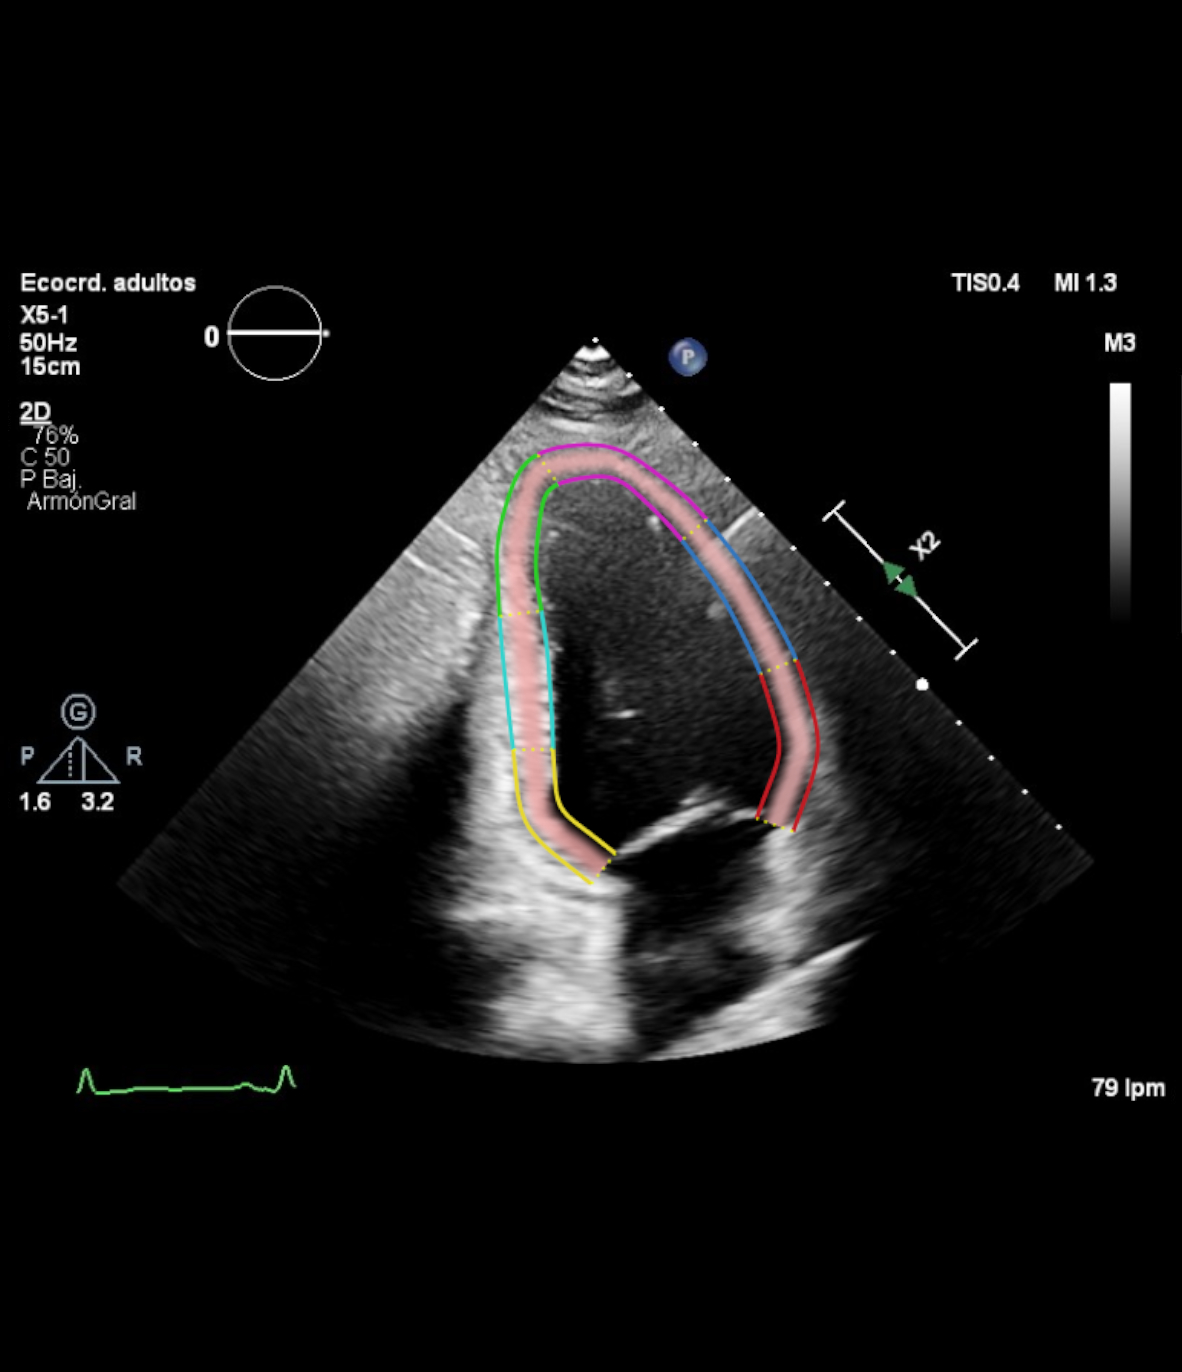
Peak strain -24.2 %
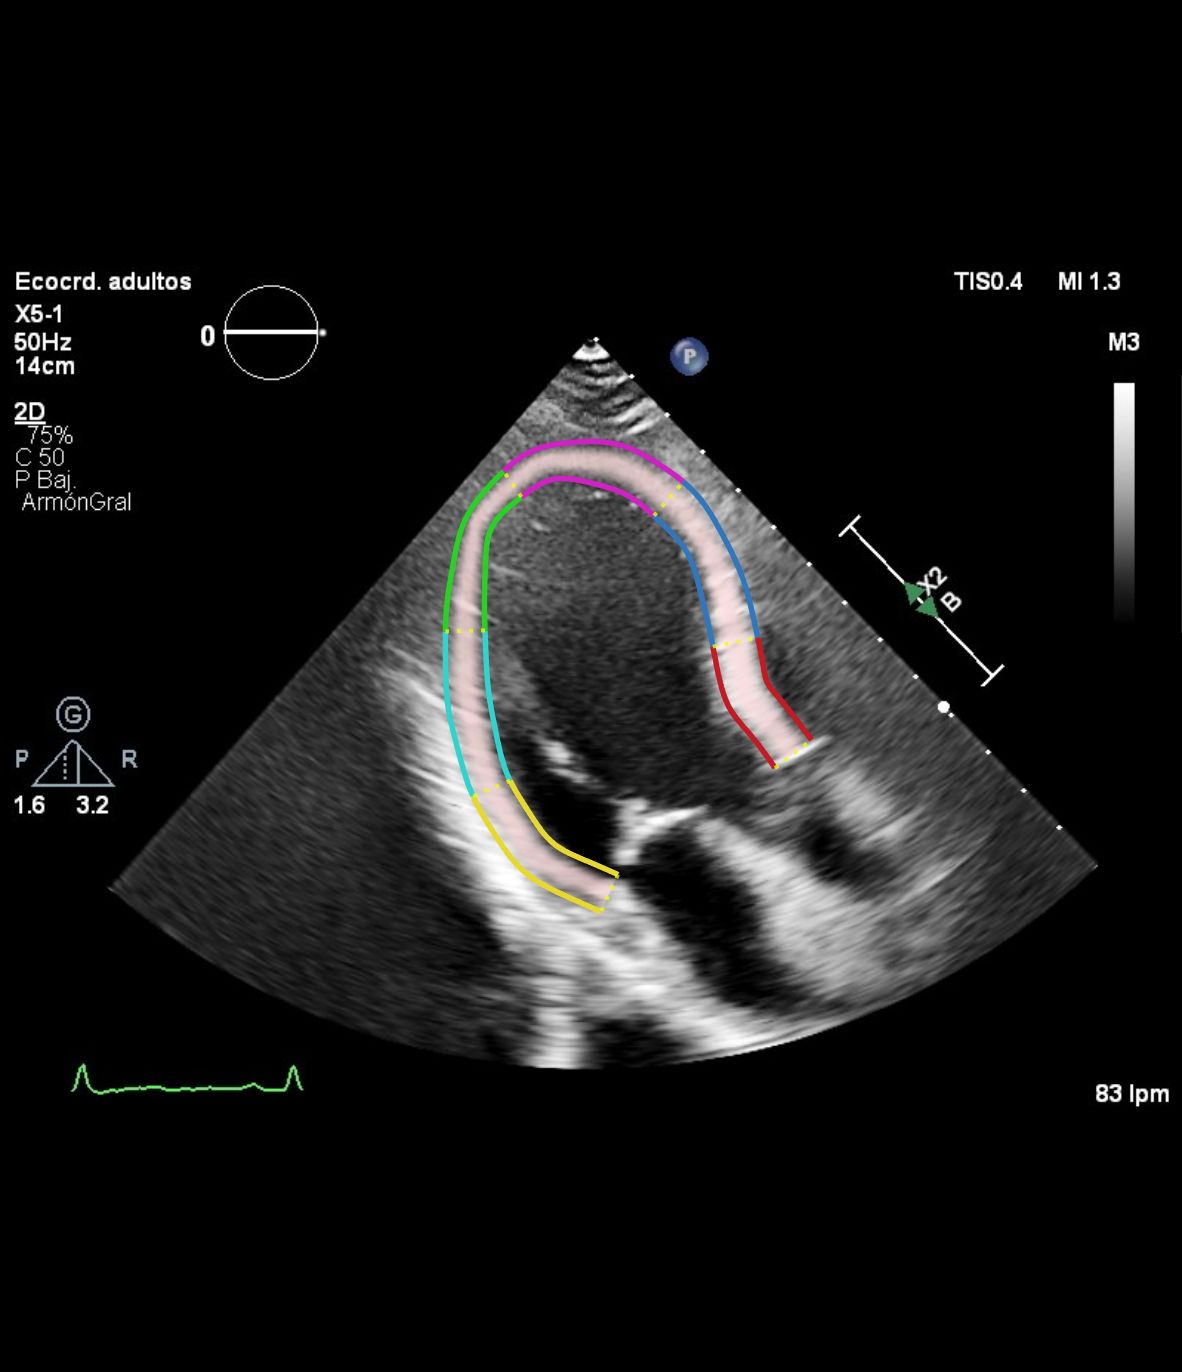
Peak strain -22.4 %
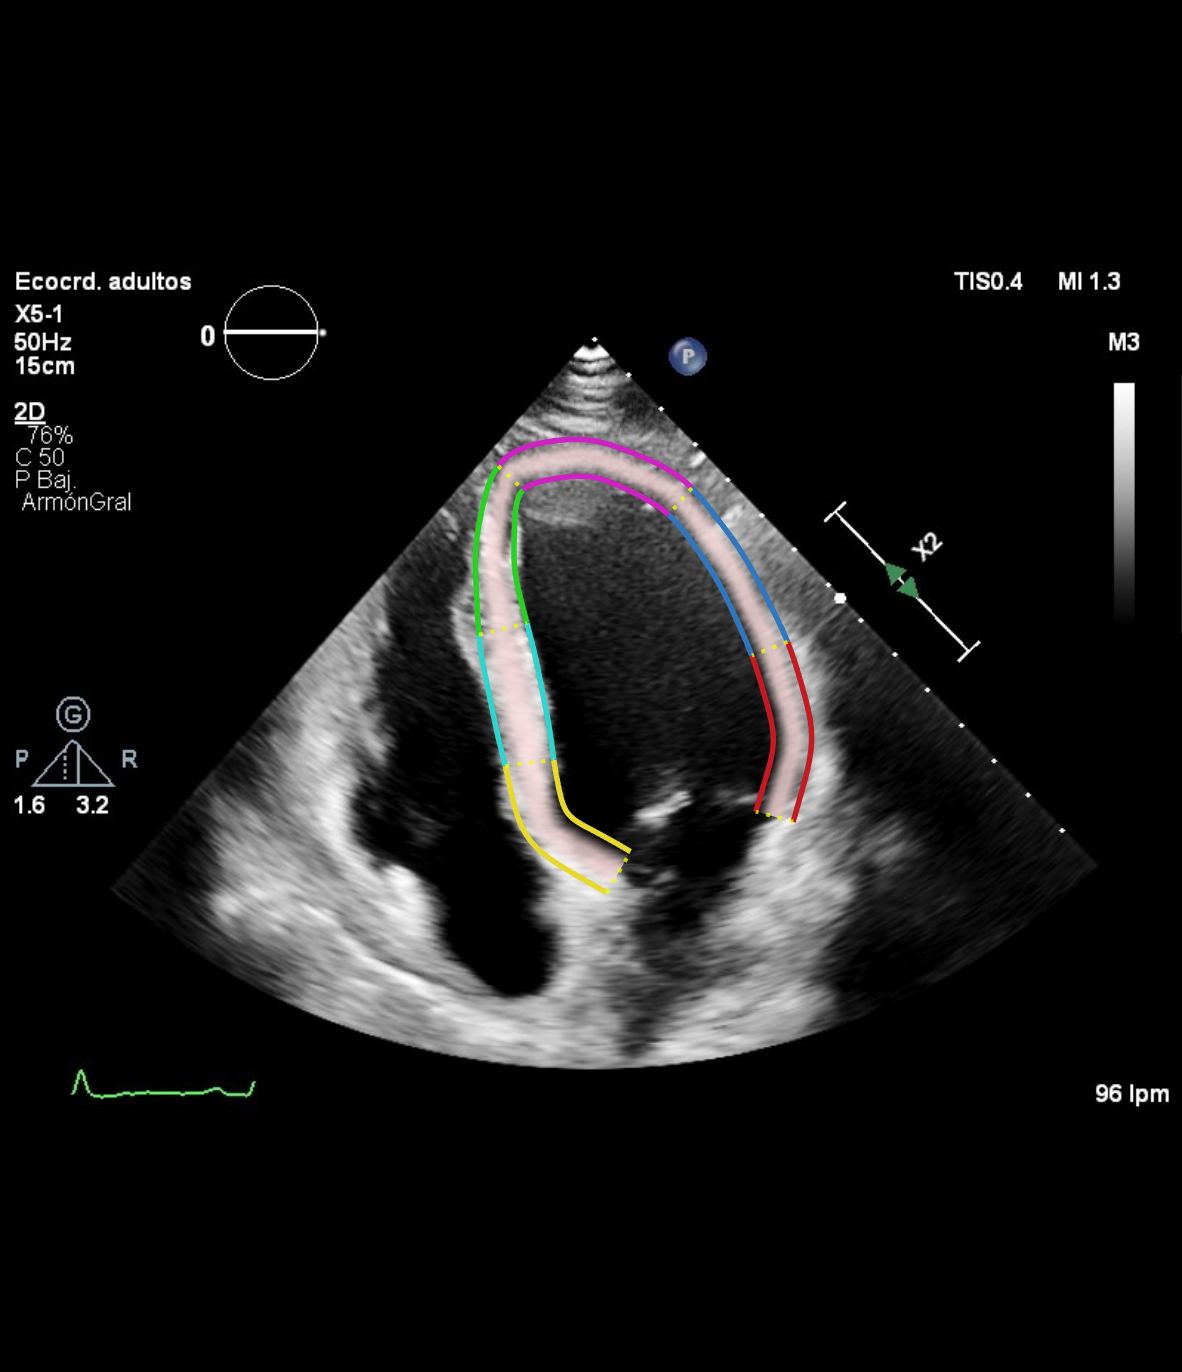
Peak strain -19 %
Click a measurement to see the view, frame and contour it comes from.
Read the report, check the measurements that matter for that patient and validate.
Reassign a view, move the end-systolic or end-diastolic frame, correct a contour or add a missing measurement.
Every figure opens on the view, frame and contour it came from, and derived values show what they are made of.
The study is uploaded securely and the report comes back in the browser. Nothing installed, nothing connected to your core systems.
Studies sync from your PACS and results go back to your electronic health record or viewer, with traceability for every study.
Standard DICOM, tested with Siemens, Philips and General Electric systems, among others. No additional hardware. Encrypted in transit and at rest.
The burden of measuring and organizing is lifted from the specialist; reading and validation stay with them. You start with one department, without committing the rest of the organization.
You pay per valid report. Nothing else.
Tiers are agreed with each center, in the markets where Cardia is available.
Trained on images from patients of different ethnic backgrounds, sexes and ages, acquired with equipment from several manufacturers.



Research
14
abstracts presented at European Society of Cardiology congresses
Published in the European Heart Journal and EHJ – Cardiovascular Imaging.
See the publications
Dr. Jonathan A. Fialkow
Cardiology and lipidology
Baptist Health Miami Cardiac & Vascular Institute, USA

Dr. Jagoba Larrazabal López
Congenital heart disease and cardiac imaging
Cruces University Hospital, Spain

Dr. Gonzalo Rodríguez
Cardiology and prevention
Latin America advisor

Prof. Pablo Lamata de la Orden
Computational cardiology
King's College London, United Kingdom




Where Cardia stands today, market by market
Status as of September 2026
Prescription software that processes, analyzes and measures previously acquired transthoracic echocardiograms and returns a structured report of cardiac parameters, to support the clinical decision-making of cardiologists, sonographers and other qualified healthcare professionals. Adult patients. It does not detect, diagnose or grade the severity of any disease.
FDA · 510(k)
Pre-submission filed on August 31, 2026. Feedback meeting with the FDA in November 2026; the next step is the 510(k) submission.
Argentina · Honduras · Costa Rica
Position communicated by the authorities (ANMAT and counterparts): support software that does not interfere with clinical practice or diagnose, and is not subject to health registration. Official written confirmation in progress.
Europe (MDR) and others
Regulatory efforts are currently focused on the FDA and Latin America. Europe and other markets will follow at a later stage.
Next step
Two ways to get started, free of charge and with no commitment.
The pilot is planned after the demo.